『Python』matplotlib划分画布的主要函数
1. subplot()
- 绘制网格区域中几何形状相同的子区布局
函数签名有两种:
subplot(numRows, numCols, plotNum)subplot(CRN)
都是整数,意思是将画布划分为C行R列个子区,此时定位到第N个子区上,子区编号按照行优先排序。
下面就是最喜爱的举例环节
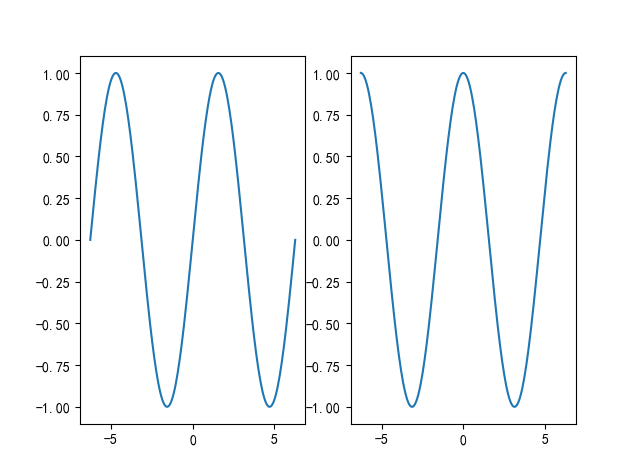
【Example 1】
import numpy as np

import matplotlib.pyplot as plt

import matplotlib as mpl

mpl.use('Qt5Agg')

mpl.rcParams['font.sans-serif'] = ['SimHei']

mpl.rcParams['font.serif'] = ['SimHei']

mpl.rcParams['axes.unicode_minus'] = False  # 解决保存图像是负号'-'显示为方块的问题,或者转换负号为字符串

x = np.linspace(-2 * np.pi, 2 * np.pi, 200)

y = np.sin(x)

y1 = np.cos(x)

plt.subplot(121)

plt.plot(x, y)

plt.subplot(122)

plt.plot(x, y1)

plt.show()
【Example 2】
import numpy as np

import matplotlib.pyplot as plt

import matplotlib as mpl

mpl.use('Qt5Agg')

mpl.rcParams['font.sans-serif'] = ['SimHei']

mpl.rcParams['font.serif'] = ['SimHei']

mpl.rcParams['axes.unicode_minus'] = False  # 解决保存图像是负号'-'显示为方块的问题,或者转换负号为字符串

fig = plt.figure()

x = np.linspace(0.0, 2 * np.pi)

y = np.cos(x) * np.sin(x)

ax1 = fig.add_subplot(121)

ax1.margins(0.03)

ax1.plot(x, y, ls="-", lw=2, color="b")

ax2 = fig.add_subplot(222)

ax2.margins(0.7, 0.7)

ax2.plot(x, y, ls="-", lw=2, color="r")

ax3 = fig.add_subplot(224)

ax3.margins(x=0.1, y=0.3)

ax3.plot(x, y, ls="-", lw=2, color="g")

plt.show()
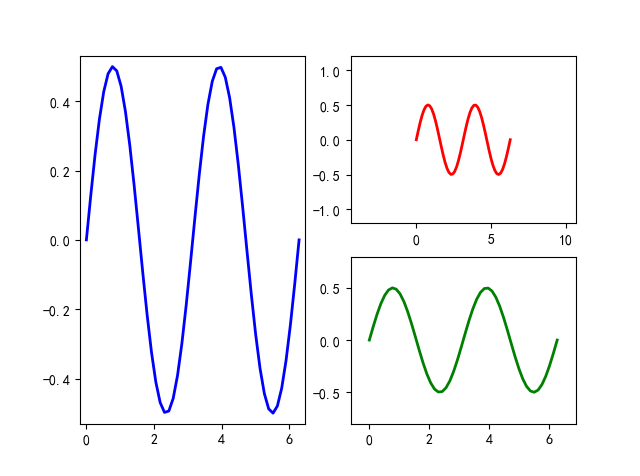
非等分画布可以多次使用等分画布来实现
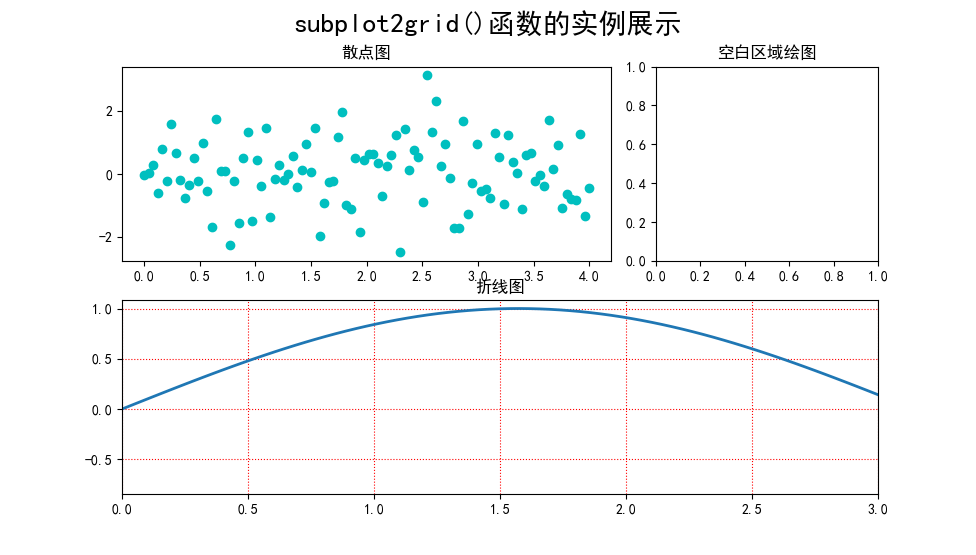
2. subplot2grid()
- 让子区跨越固定的网格布局
直接上示例
import numpy as np

import matplotlib.pyplot as plt

import matplotlib as mpl

mpl.use('Qt5Agg')

mpl.rcParams['font.sans-serif'] = ['SimHei']

mpl.rcParams['font.serif'] = ['SimHei']

mpl.rcParams['axes.unicode_minus'] = False  # 解决保存图像是负号'-'显示为方块的问题,或者转换负号为字符串

plt.subplot2grid((2, 3), (0, 0), colspan=2)

x = np.linspace(0.0, 4.0, 100)

y = np.random.randn(100)

plt.scatter(x, y, c="c")

plt.title("散点图")

plt.subplot2grid((2, 3), (0, 2))

plt.title("空白区域绘图")

plt.subplot2grid((2, 3), (1, 0), colspan=3)

y1 = np.sin(x)

plt.plot(x, y1, lw=2, ls="-")

plt.xlim(0, 3)

plt.grid(True, ls=":", c="r")

plt.title("折线图")

plt.suptitle("subplot2grid()函数的实例展示", fontsize=20)

plt.show()
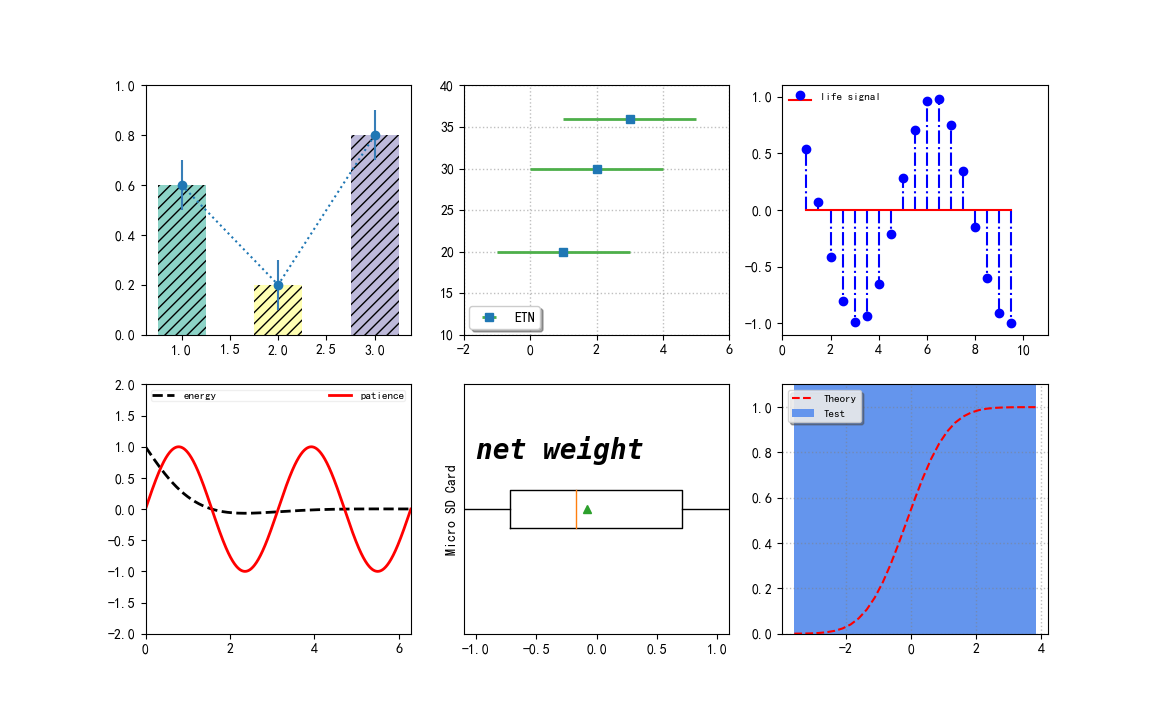
3. subplots()
创建一张画布带有多个子区的绘图模式
其返回值是
(fig, ax)的元组,fig是Figure的实例,ax是axis对象数组或者一个axis对象
【综合示例】
import numpy as np

import matplotlib.pyplot as plt

import matplotlib as mpl

mpl.use('Qt5Agg')

mpl.rcParams['font.sans-serif'] = ['SimHei']

mpl.rcParams['font.serif'] = ['SimHei']

mpl.rcParams['axes.unicode_minus'] = False  # 解决保存图像是负号'-'显示为方块的问题,或者转换负号为字符串

fig, ax = plt.subplots(2, 3)

# subplot(231)

colors = ["#8dd3c7", "#ffffb3", "#bebada"]

ax[0, 0].bar([1, 2, 3], [0.6, 0.2, 0.8], color=colors, width=0.5, hatch="///", align="center")

ax[0, 0].errorbar([1, 2, 3], [0.6, 0.2, 0.8], yerr=0.1, capsize=0, ecolor="#377eb8", fmt="o:")

ax[0, 0].set_ylim(0, 1.0)

# subplot(232)

ax[0, 1].errorbar([1, 2, 3], [20, 30, 36], xerr=2, ecolor="#4daf4a", elinewidth=2, fmt="s", label="ETN")

ax[0, 1].legend(loc=3, fancybox=True, shadow=True, fontsize=10, borderaxespad=0.4)

ax[0, 1].set_ylim(10, 40)

ax[0, 1].set_xlim(-2, 6)

ax[0, 1].grid(ls=":", lw=1, color="grey", alpha=0.5)

# subplot(233)

x3 = np.arange(1, 10, 0.5)

y3 = np.cos(x3)

ax[0, 2].stem(x3, y3, basefmt="r-", linefmt="b-.", markerfmt="bo", label="life signal", use_line_collection=True)

ax[0, 2].legend(loc=2, fontsize=8, frameon=False, borderpad=0.0, borderaxespad=0.6)

ax[0, 2].set_xlim(0, 11)

ax[0, 2].set_ylim(-1.1, 1.1)

# subplot(234)

x4 = np.linspace(0, 2 * np.pi, 500)

x4_1 = np.linspace(0, 2 * np.pi, 1000)

y4 = np.cos(x4) * np.exp(-x4)

y4_1 = np.sin(2 * x4_1)

line1, line2, = ax[1, 0].plot(x4, y4, "k--", x4_1, y4_1, "r-", lw=2)

ax[1, 0].legend((line1, line2), ("energy", "patience"),

                loc="upper center", fontsize=8, ncol=2,

                framealpha=0.3, mode="expand",

                columnspacing=2, borderpad=0.1)

ax[1, 0].set_ylim(-2, 2)

ax[1, 0].set_xlim(0, 2 * np.pi)

# subplot(235)

x5 = np.random.randn(100)

ax[1, 1].boxplot(x5, vert=False, showmeans=True, meanprops=dict(color="g"))

ax[1, 1].set_yticks([])

ax[1, 1].set_xlim(-1.1, 1.1)

ax[1, 1].set_ylabel("Micro SD Card")

ax[1, 1].text(-1.0, 1.2, "net weight", fontsize=20, style="italic",

              weight="black", family="monospace")

# subplot(236)

mu = 0.0

sigma = 1.0

x6 = np.random.randn(10000)

n, bins, patches = ax[1, 2].hist(x6, bins=30,

                                 histtype="stepfilled", cumulative=True,

                                 color="cornflowerblue", label="Test")

y = ((1 / (np.sqrt(2 * np.pi) * sigma)) * np.exp(-0.5 * (1 / sigma * (bins - mu)) ** 2))

y = y.cumsum()

y /= y[-1]

ax[1, 2].plot(bins, y, "r--", linewidth=1.5, label="Theory")

ax[1, 2].set_ylim(0.0, 1.1)

ax[1, 2].grid(ls=":", lw=1, color="grey", alpha=0.5)

ax[1, 2].legend(loc="upper left", fontsize=8, shadow=True, fancybox=True, framealpha=0.8)

# adjust subplots() layout

plt.subplots_adjust()

plt.show()
『Python』matplotlib划分画布的主要函数的更多相关文章
- 『Python』matplotlib坐标轴应用
1. 设置坐标轴的位置和展示形式 import numpy as np import matplotlib.pyplot as plt import matplotlib as mpl mpl.use ...
- 『Python』matplotlib初识
1. 核心原理 使用matplotlib绘图的原理,主要就是理解figure(画布).axes(坐标系).axis(坐标轴)三者之间的关系. 下面这幅图更详细: 以"美院学生张三写生画画&q ...
- 『Python』matplotlib的imshow用法
热力图是一种数据的图形化表示,具体而言,就是将二维数组中的元素用颜色表示.热力图之所以非常有用,是因为它能够从整体视角上展示数据,更确切的说是数值型数据. 使用imshow()函数可以非常容易地制作热 ...
- 『Python』matplotlib实现GUI效果
1. 类RadioButtons的使用方法 类似单选框 import numpy as np import matplotlib.pyplot as plt import matplotlib as ...
- 『Python』matplotlib实现动画效果
一般而言,在绘制复杂动画时,主要借助模块animation来完成 import numpy as np import matplotlib.pyplot as plt import matplotli ...
- 『Python』matplotlib共享绘图区域坐标轴
1. 共享单一绘图区域的坐标轴 有时候,我们想将多张图形放在同一个绘图区域,不想在每个绘图区域只绘制一幅图形.这时候,就可以借助共享坐标轴的方法实现在一个绘图区域绘制多幅图形的目的. import n ...
- 『Python』matplotlib常用图表
这里简要介绍几种统计图形的绘制方法,其他更多图形可以去matplotlib找examples魔改 1. 柱状图 柱状图主要是应用在定性数据的可视化场景中,或是离散数据类型的分布展示.例如,一个本科班级 ...
- 『Python』matplotlib常用函数
1. 绘制图表组成元素的主要函数 1.1 plot()--展现量的变化趋势 import numpy as np import matplotlib.pyplot as plt import matp ...
- 『Python』__getattr__()特殊方法
self的认识 & __getattr__()特殊方法 将字典调用方式改为通过属性查询的一个小class, class Dict(dict): def __init__(self, **kw) ...
随机推荐
- SQL 练习10
查询没有学全所有课程的同学的信息 分析 先查询出所有课程的数量 select count(cid) from course 再查询出成绩表中课程数量=总课数的人员 select sid from sc ...
- C#实现http协议GET、POST请求
using System; using System.Collections.Generic; using System.Text; using System.Net; using System.Ne ...
- 【转】new和malloc的区别
1. 申请的内存所在位置 new操作符从自由存储区(free store)上为对象动态分配内存空间,而malloc函数从堆上动态分配内存. 自由存储区是C++基于new操作符的一个抽象概念,凡是通过n ...
- C# Monitor.Wait() 源码追踪 (转载)
source: 释放对象上的锁并阻止当前线程,直到它重新获取该锁. 如果已用指定的超时时间间隔,则线程进入就绪队列. 可以在等待之前退出同步上下文的同步域,随后重新获取该域. [SecuritySaf ...
- 【springcloud】Eureka服务注册中心搭建
转自:https://blog.csdn.net/pengjunlee/article/details/86538997 Spring Cloud是一系列框架的集合,它利用Spring Boot的开发 ...
- Python的GPU编程实例——近邻表计算
技术背景 GPU加速是现代工业各种场景中非常常用的一种技术,这得益于GPU计算的高度并行化.在Python中存在有多种GPU并行优化的解决方案,包括之前的博客中提到的cupy.pycuda和numba ...
- Redis(二):基本数据类型
基础 # redis默认有16个数据库,数组下标从0开始,默认使用0号库 # 当我们启动服务器并连接客户端之后: set <key> <value> # 向数据库中添加数据用于 ...
- MySQL基础——常用命令
一.连接MySQL 1.启动mysql首先在打开cmd窗口,输入mysql -uroot -p ,然后空格进入MySQL控制台,MySQL的提示符是: mysql>. mysql -uroot ...
- ArrayPool 源码解读之 byte[] 也能池化?
一:背景 1. 讲故事 最近在分析一个 dump 的过程中发现其在 gen2 和 LOH 上有不少size较大的free,仔细看了下,这些free生前大多都是模板引擎生成的html片段的byte[]数 ...
- PC微信多开
1.桌面上面新建一个 多开.txt . 2.将下面的内容拷贝进去 TASKKILL /F /IM wechat.exestart "" "E:\wechat\WeCha ...