python-matplotlib-lec0
直奔主题吧。。以下是对matplotlib画图的简单讲解,代码已测试。
win7 + pycharm + python 2.7
参考文档:
http://old.sebug.net/paper/books/scipydoc/matplotlib_intro.html
捷径:查看gallery,寻找要画的图,copy代码,修改,done
http://matplotlib.org/gallery.html
# -*- coding: utf-8 -*-
import numpy as np
import matplotlib.pyplot as plt x = np.linspace(0, 10, 1000)
y = np.sin(x)
z = np.cos(x**2) # figsize:单位为英寸 dpi:指定绘图对象的分辨率,default is 80.
# 宽度现在为8*80=640
# 但是用工具栏中的保存按钮保存下来的png图像的大小是800*400像素。 plt.figure(figsize=(8,4))
# latex inserted, use it directly.
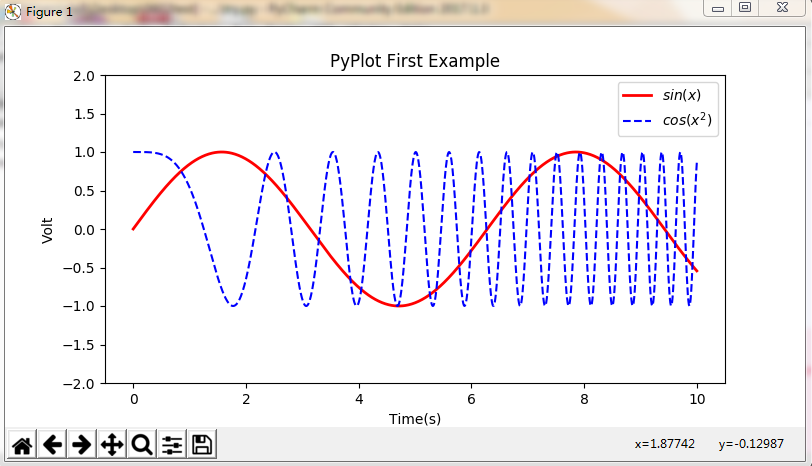
plt.plot(x,y,label="$sin(x)$",color="red",linewidth=2)
# "b--":formated string, blue and dashed line
plt.plot(x,z,"b--",label="$cos(x^2)$")
plt.xlabel("Time(s)")
plt.ylabel("Volt")
plt.title("PyPlot First Example")
plt.ylim(-2, 2)
plt.legend()
plt.show() # figure(i) means draw ith figure. If i exists, it will not create new figure object,
# but make it as current figure object plt.figure(1)
plt.plot(x,y,label="$sin(x)$",color="red",linewidth=2)
plt.show()
plt.figure(2)
plt.plot(x,z,"b--",label="$cos(x^2)$")
plt.show()
python-matplotlib-lec0的更多相关文章
- python matplotlib 中文显示参数设置
python matplotlib 中文显示参数设置 方法一:每次编写代码时进行参数设置 #coding:utf-8import matplotlib.pyplot as pltplt.rcParam ...
- python matplotlib plot 数据中的中文无法正常显示的解决办法
转发自:http://blog.csdn.net/laoyaotask/article/details/22117745?utm_source=tuicool python matplotlib pl ...
- python matplotlib画图产生的Type 3 fonts字体没有嵌入问题
ScholarOne's 对python matplotlib画图产生的Type 3 fonts字体不兼容,更改措施: 在程序中添加如下语句 import matplotlib matplotlib. ...
- 使用Python matplotlib做动态曲线
今天看到“Python实时监控CPU使用率”的教程: https://www.w3cschool.cn/python3/python3-ja3d2z2g.html 自己也学习如何使用Python ma ...
- python matplotlib 中文显示乱码设置
python matplotlib 中文显示乱码设置 原因:是matplotlib库中没有中文字体.1 解决方案:1.进入C:\Anaconda64\Lib\site-packages\matplot ...
- Python - matplotlib 数据可视化
在许多实际问题中,经常要对给出的数据进行可视化,便于观察. 今天专门针对Python中的数据可视化模块--matplotlib这块内容系统的整理,方便查找使用. 本文来自于对<利用python进 ...
- 转:使用 python Matplotlib 库 绘图 及 相关问题
使用 python Matplotlib 库绘图 转:http://blog.csdn.net/daniel_ustc/article/details/9714163 Matplotlib ...
- python+matplotlib 绘制等高线
python+matplotlib 绘制等高线 步骤有七: 有一个m*n维的矩阵(data),其元素的值代表高度 构造两个向量:x(1*n)和y(1*m).这两个向量用来构造网格坐标矩阵(网格坐标矩阵 ...
- 安装python Matplotlib 库
转:使用 python Matplotlib 库 绘图 及 相关问题 使用 python Matplotlib 库绘图 转:http://blog.csdn.net/daniel_ustc ...
- python matplotlib.pyplot 散点图详解(1)
python matplotlib.pyplot散点图详解(1) 一.创建散点图 可以用scatter函数创建散点图 并使用show函数显示散点图 代码如下: import matplotlib.py ...
随机推荐
- Ubuntu新服务器安装lnmp
版本: nginx(无要求,最新) mysql(5.6.xx) php(5.6.xx) ubuntu(16.04,其他版本也并无过多差异) 准备: #apt-get update #apt-get i ...
- missfresh问题记录
一.基本信息 1.登陆机器 ssh lina02@mjump.missfresh.net -p2222 二.问题 1.分页问题:job_id为空时能查询出来(笛卡尔乘积),需要加上AND res ...
- 如何安装使用windows自带的telnet服务
控制面板->程序和功能->打开或关闭Windows功能->Telnet 客户端 [ Telnet 服务器 ] 安装完成后重启cmd telnet ip port
- HDU 1160 FatMouse's Speed LIS DP
http://acm.hdu.edu.cn/showproblem.php?pid=1160 同样是先按它的体重由小到大排,相同就按speed排就行. 这样做的好处是,能用O(n^2)枚举,因为前面的 ...
- Java中常见的坑
概述 Java是门极简风格的语言,比其它语言相比,它故意保持较少的特性,不仅在有些不常见的情况下会出些奇奇怪怪的错误,即使很一般的情况下也有可能让人栽根头.如果你习惯了别的语言,你读Java 的代码很 ...
- Myeclipse发布第一个jsp页面及web project部署到tomcat上的几种方法
菜鸟日记: 1:new web project: 2:fix the visiting path of the tomcat,打开在安装目录下conf目录中的server.xml,在</Hos ...
- Kendo MVVM 数据绑定(八) Style
Kendo MVVM 数据绑定(八) Style Style 绑定可以通过 ViewModel 绑定到 DOM 元素 CSS 风格属性,例如: <span data-bind="sty ...
- 织梦dedecms后台登陆密码充值工具
下载后解压,根据自己语言版本,把文件radminpass.php放入网站根目录下执行即可 点击下载:织梦dedecms后台登陆密码充值工具
- PHP生成类似类似优酷、腾讯视频等其他视频链的ID
不知道你注意了没有,类似优酷.腾讯视频等其他视频链接似乎类似这样的 http://v.youku.com/v_show/id_XNjA5MjE5OTM2.html 注意id_xxx那段,是不是看不懂了 ...
- UVA 11134 FabledRooks 传说中的车 (问题分解)
摘要:贪心,问题分解. 因为行列无关,所以这个二维问题可以分解成两个一维问题. 优先队列实现:类似区间点覆盖的问题,先按照左端点排序,相同然后在按右端点排序(灵活性小的优先选).最优的选法,当然是要使 ...