
《DSP using MATLAB》Problem 7.23
%% ++++++++++++++++++++++++++++++++++++++++++++++++++++++++++++++++++++++++++++++++

%%            Output Info about this m-file

fprintf('\n***********************************************************\n');

fprintf('        <DSP using MATLAB> Problem 7.23 \n\n');

banner();

%% ++++++++++++++++++++++++++++++++++++++++++++++++++++++++++++++++++++++++++++++++

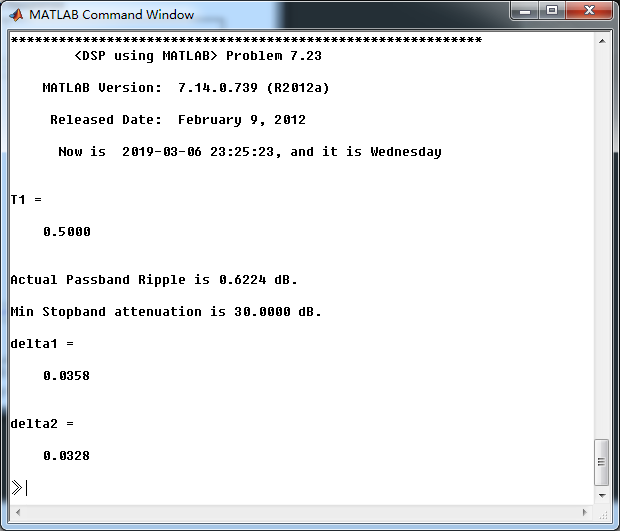
T1 = 0.5

wc = 0.3*pi;

M = 40; alpha = (M-1)/2; l = 0:M-1; wl = (2*pi/M)*l;

Hrs = [ones(1, 6), T1, zeros(1, 27), T1, ones(1, 5)];      % Ideal Amp Res sampled

Hdr = [1, 1, 0, 0]; wdl = [0, 0.3, 0.3, 1];                % Ideal Amp Res for plotting

k1 = 0:floor((M-1)/2); k2 = floor((M-1)/2)+1:M-1;

%% ----------------------------------

%%           Type-2 LPF

%% ----------------------------------

angH = [-alpha*(2*pi)/M*k1, alpha*(2*pi)/M*(M-k2)];

H = Hrs.*exp(j*angH); h = real(ifft(H, M));

[db, mag, pha, grd, w] = freqz_m(h, 1); delta_w = 2*pi/1000;

[Hr, ww, a, L] = Hr_Type2(h);

Rp = -(min(db(1 :1: floor(wc/delta_w)-20)));                      % Actual Passband Ripple

fprintf('\nActual Passband Ripple is %.4f dB.\n', Rp);

As = -round(max(db(floor(0.35*pi/delta_w)+1 : 1 : 501)));        % Min Stopband attenuation

fprintf('\nMin Stopband attenuation is %.4f dB.\n', As);

[delta1, delta2] = db2delta(Rp, As)

%% Plot a

figure('NumberTitle', 'off', 'Name', 'Problem 7.23a')

set(gcf,'Color','white');

subplot(2,2,1); plot(wl(1:21)/pi, Hrs(1:21), 'o', wdl, Hdr, 'r'); axis([0, 1, -0.1, 1.1]);

set(gca,'YTickMode','manual','YTick',[0,0.5,1]);

set(gca,'XTickMode','manual','XTick',[0,0.3,0.5,1]);

xlabel('frequency in \pi nuits'); ylabel('Hr(k)'); title('Frequency Samples: M=40, T1=0.5');

grid on;

subplot(2,2,2); stem(l, h); axis([-1, M, -0.1, 0.3]); grid on;

xlabel('n'); ylabel('h(n)'); title('Impulse Response');

subplot(2,2,3); plot(ww/pi, Hr, 'r', wl(1:21)/pi, Hrs(1:21), 'o'); axis([0, 1, -0.2, 1.2]); grid on;

xlabel('frequency in \pi units'); ylabel('Hr(w)'); title('Amplitude Response');

set(gca,'YTickMode','manual','YTick',[0,0.5,1]);

set(gca,'XTickMode','manual','XTick',[0,0.3,0.5,1]);

subplot(2,2,4); plot(w/pi, db); axis([0, 1, -100, 10]); grid on;

xlabel('frequency in \pi units'); ylabel('Decibels'); title('Magnitude Response');

set(gca,'YTickMode','manual','YTick',[-90,-30,0]);

set(gca,'YTickLabelMode','manual','YTickLabel',['90';'30';' 0']);

set(gca,'XTickMode','manual','XTick',[0,0.3,0.5,1]);

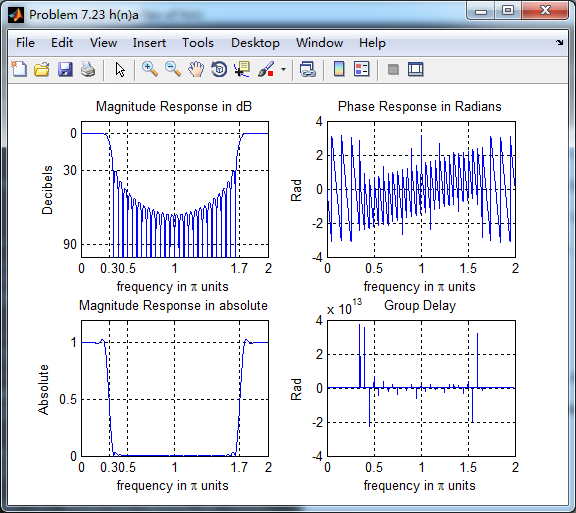
figure('NumberTitle', 'off', 'Name', 'Problem 7.23 h(n)a')

set(gcf,'Color','white');

subplot(2,2,1); plot(w/pi, db); grid on; axis([0 2 -100 10]);

xlabel('frequency in \pi units'); ylabel('Decibels'); title('Magnitude Response in dB');

set(gca,'YTickMode','manual','YTick',[-90,-30,0]);

set(gca,'YTickLabelMode','manual','YTickLabel',['90';'30';' 0']);

set(gca,'XTickMode','manual','XTick',[0,0.3,0.5,1,1.7,2]);

subplot(2,2,3); plot(w/pi, mag); grid on; axis([0 2 0 1.2]);

xlabel('frequency in \pi units'); ylabel('Absolute'); title('Magnitude Response in absolute');

set(gca,'XTickMode','manual','XTick',[0,0.3,0.5,1,1.7,2]);

subplot(2,2,2); plot(w/pi, pha); grid on; %axis([0 1 -100 10]);

xlabel('frequency in \pi units'); ylabel('Rad'); title('Phase Response in Radians');

subplot(2,2,4); plot(w/pi, grd*pi/180);  grid on; %axis([0 1 -100 10]);

xlabel('frequency in \pi units'); ylabel('Rad'); title('Group Delay');

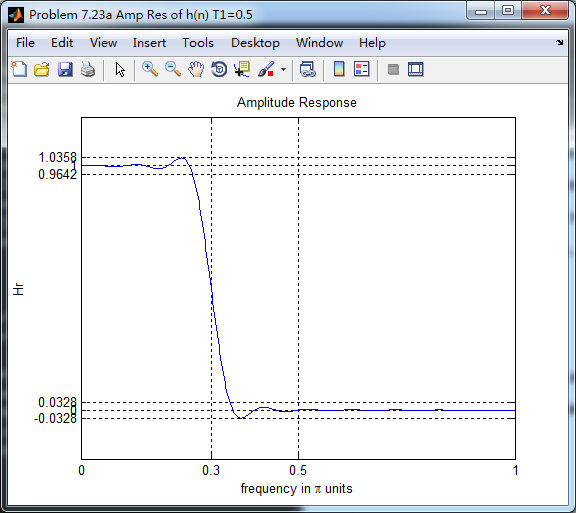
figure('NumberTitle', 'off', 'Name', 'Problem 7.23a Amp Res of h(n) T1=0.5')

set(gcf,'Color','white');

plot(ww/pi, Hr); grid on; %axis([0 1 -100 10]);

xlabel('frequency in \pi units'); ylabel('Hr'); title('Amplitude Response');

set(gca,'YTickMode','manual','YTick',[-delta2,0,delta2,1-delta1,1,1+ delta1])

%set(gca,'YTickLabelMode','manual','YTickLabel',['90';'45';' 0']);

set(gca,'XTickMode','manual','XTick',[0,0.3,0.5,1,1.7,2]);
运行结果:

《DSP using MATLAB》Problem 7.23的更多相关文章
- 《DSP using MATLAB》Problem 6.23
代码: %% ++++++++++++++++++++++++++++++++++++++++++++++++++++++++++++++++++++++++++++++++ %% Output In ...
- 《DSP using MATLAB》Problem 4.23
代码: %% ------------------------------------------------------------------------ %% Output Info about ...
- 《DSP using MATLAB》Problem 5.22
代码: %% ++++++++++++++++++++++++++++++++++++++++++++++++++++++++++++++++++++++++++++++++++++++++ %% O ...
- 《DSP using MATLAB》Problem 5.2
代码: %% ---------------------------------------------------------------------------------- %% Output ...
- 《DSP using MATLAB》Problem 4.15
只会做前两个, 代码: %% ---------------------------------------------------------------------------- %% Outpu ...
- 《DSP using MATLAB》Problem 8.34
今天下了小雨,空气中泛起潮湿的味道,阴冷的感觉袭来,心情受到小小影响. 代码: hp2lpfre子函数 function [wpLP, wsLP, alpha] = hp2lpfre(wphp, ws ...
- 《DSP using MATLAB》Problem 8.30
10月1日,新中国70周岁生日,上午观看了盛大的庆祝仪式,整齐的方阵,先进的武器,尊敬的先辈英雄,欢乐的人们,愿我们的 国家越来越好,人民生活越来越好. 接着做题. 代码: %% ---------- ...
- 《DSP using MATLAB》Problem 7.34
代码: %% ++++++++++++++++++++++++++++++++++++++++++++++++++++++++++++++++++++++++++++++++ %% Output In ...
- 《DSP using MATLAB》Problem 7.30
代码: %% ++++++++++++++++++++++++++++++++++++++++++++++++++++++++++++++++++++++++++++++++ %% Output In ...
随机推荐
- CICD自动化发版系统设计简介
第一篇. 版本迭代是每一个互联网公司必须经历的,尤其是中小型公司,相信不少人踩到过很多坑.接下来的一系列文章将介绍我设计的自动化发版系统! 很多公司没有把配置独立出去,代码的构建.发版通过一个Jenk ...
- HTML DOM 的nodeType属性
在HTML DOM中每一部分都是节点: HTML元素是元素节点 HTML中属性是属性节点 文本是文本节点 注释是注释节点 这时我们要给它区分开我们就可以使用HTML DOM的nodeType属性 no ...
- 释放jQuery 的$ 的使用权
1.释放操作必须在编写其他jquery 代码之前编写,释放之后就不能使用$,改为jQuery . jQuery.noConflict(); 2.也可以自定义访问符号 var nb = jQue ...
- Spring工作原理及应用
spring原理 内部最核心的就是IOC了,动态注入,让一个对象的创建不用new了,可以自动的生产,这其实就是利用java里的反射,反射其实就是在运行时动态的去创建.调用对象,Spring就是在运行时 ...
- java往MongDB导入大量数据
好几月没写博客了~~~ --------------------- 在公司最近在搞用java往MongDB导入数据 现在是我刚导入2000W条数据了 所以就先写上吧,废话也不多说了 MongDB 我本 ...
- URL和URL比较
浅谈URI和URL URI(Uniform Resource Identifier)字面上的意思是,统一资源标示符 URL(Uniform Resource Locator),统一资源定位符 光从字面 ...
- python笔记——随手记
1.max与min函数的使用min(0)返回该矩阵中每一列的最小值 min(1)返回该矩阵中每一行的最小值 max(0)返回该矩阵中每一列的最大值 max(1)返回该矩阵中每一行的最大值2.argso ...
- 中国科学技术大学第五届信息安全大赛(hackergame2018自我总结)2
这一批题都是我不会的,只能把官方write-up放在这里了 1.FLXG 的秘密 ----------------------------------------------------------- ...
- 如何快速判断一个key是否存在在亿级数据中(bloomFilters)
面试题 现在有一个非常庞大的数据(亿级),假设全是 int 类型.现在我给你一个数,你需要告诉我它是否存在其中(尽量高效) 分析 采用bloomFilters进行实现(时间&空间尽可能的有效) ...
- springboot application.properties 常用完整版配置信息
从springboot官方文档中扒出来的,留存一下以后应该会用到 # ================================================================= ...