Unity3D\2D手机游戏开发 学习
How do I use RenderDoc on Android?
How do I inspect a pixel value?
How do I view a specific texture?
How do I view details of an object?
How do I use a custom visualisation shader?
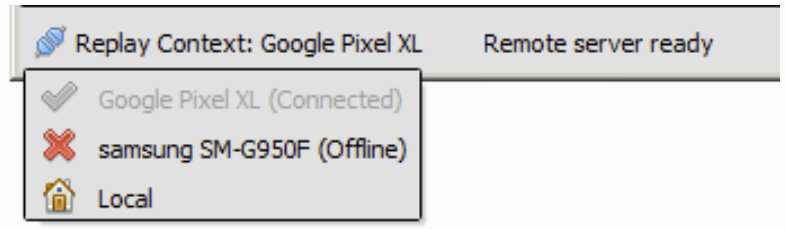
How do I capture and replay over a network?
How do I import or export a capture?
How do I generate an RGP profile?
How do I write a python extension?
How do I capture a frame?
Capturing frames
Injecting into a Process
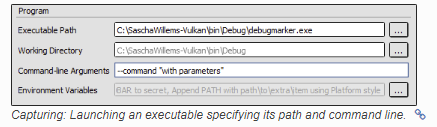
Capture settings
How do I use RenderDoc on Android?
RenderDoc contains support for Android for both Vulkan and OpenGL ES.
The Android device must be running at least Android 6.0
Quick start
Android is supported by using Remote Contexts to debug applications on your device from a host computer.

Troubleshooting
adb devices
How do I debug a shader?
Shader debugging is currently only supported in D3D11. On other APIs the debug options listed below will either be hidden or disabled
Including debug info in shaders
Debugging a vertex
Debugging a Pixel
Debugging a Computer thread
Debugging Controls
HLSL Debugging
Debugging Displays
How do I inspect a pixel value?
When in the texture viewer you can inspect the pixel values to obtain the exact contents of any pixel in the texture
Selecting appropriate subresource
Picking a Pixel Value

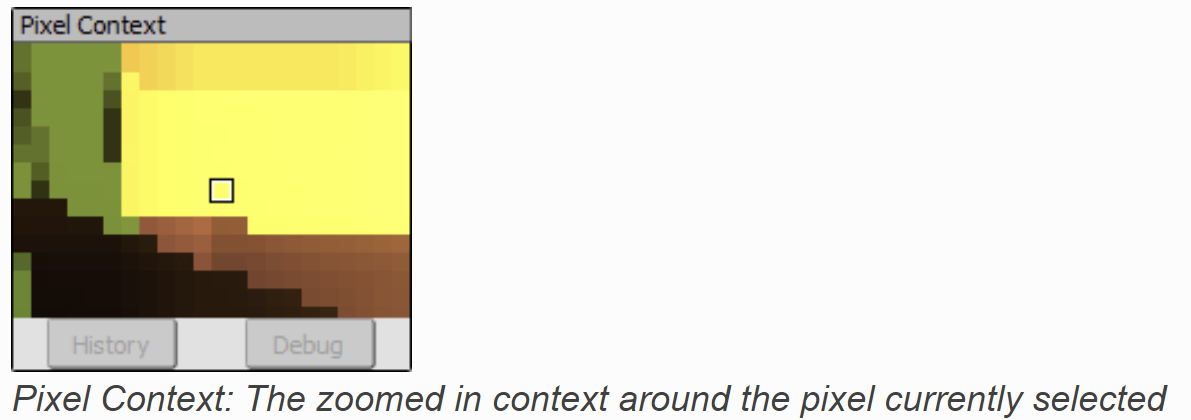
Pixel Context Display
Pixel History
How do I view a specific texture?
Annotating resources with names
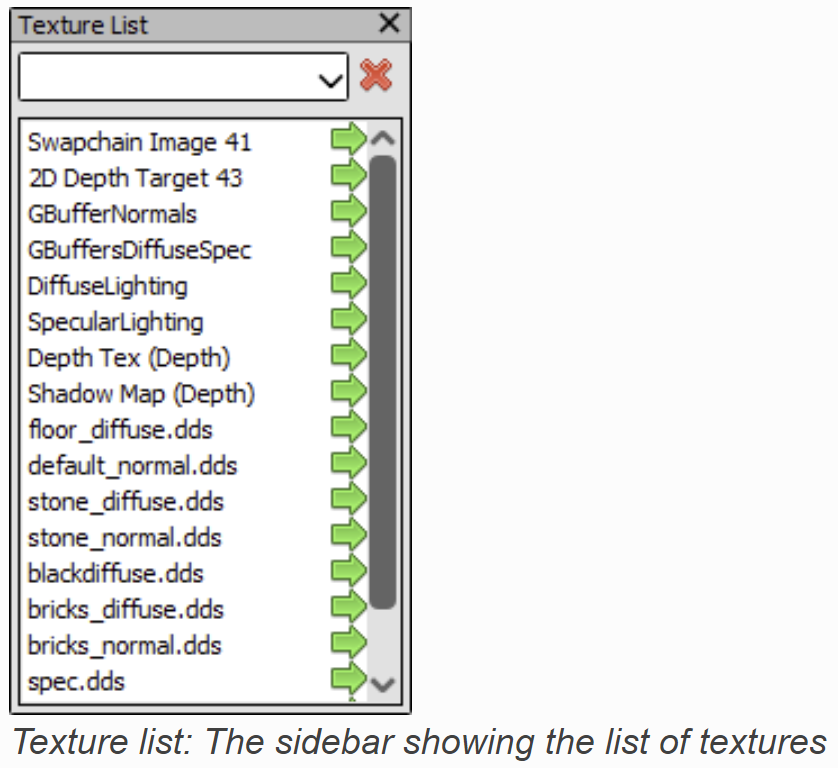
Texture list in Texture Viewer
Locked tab of a Texture
How do I view details of an object?
The pipeline state viewers allows you to view more details of given resources that are bound to the pipeline. The go arrow is a sign that more details for this resource are available
Resources that are written in bold text with a  are clickable links that lead to the Resource Inspector with more information about a given resource.
Viewing Shaders
Viewing Textures
Viewing Buffers
Viewing Constant Buffers
How do I capture callstacks?
How do I use a custom visualisation shader?
How do I edit a shader?
How do I capture and replay over a network?
How do I annotate a capture?
How do I import or export a capture?
How do I generate an RGP profile?
How do I write a python extension?
How do I control the replay?
Texture Viewer
API Insepctor
Buffer/Mesh Viewer
Capture Dialog
Event Browser
The Event Browser is the primary method of browsing the frame and selecting different drawcalls. It displays the user-annotated hierarchical display of sections
Annotating your frame
Selecting available columns
Timing drawcalls
To time the GPU duration of each drawcall, click the timer button 
This will automatically run a process to get the time of each drawcall and display it in the duration column, which will be added if necessary.
You can configure which time unit is used for the duration column on the fly in the Settings Window
To examine more GPU counters than just plain duration, see Performance Counter Viewer.
Browsing the frame
The event browser is the primary way to browse through the frame. Events are listed as entires in the browser and the hierarchical labels mentioned become tree nodes
The current selected event is highlighted and indicated with a green flag 
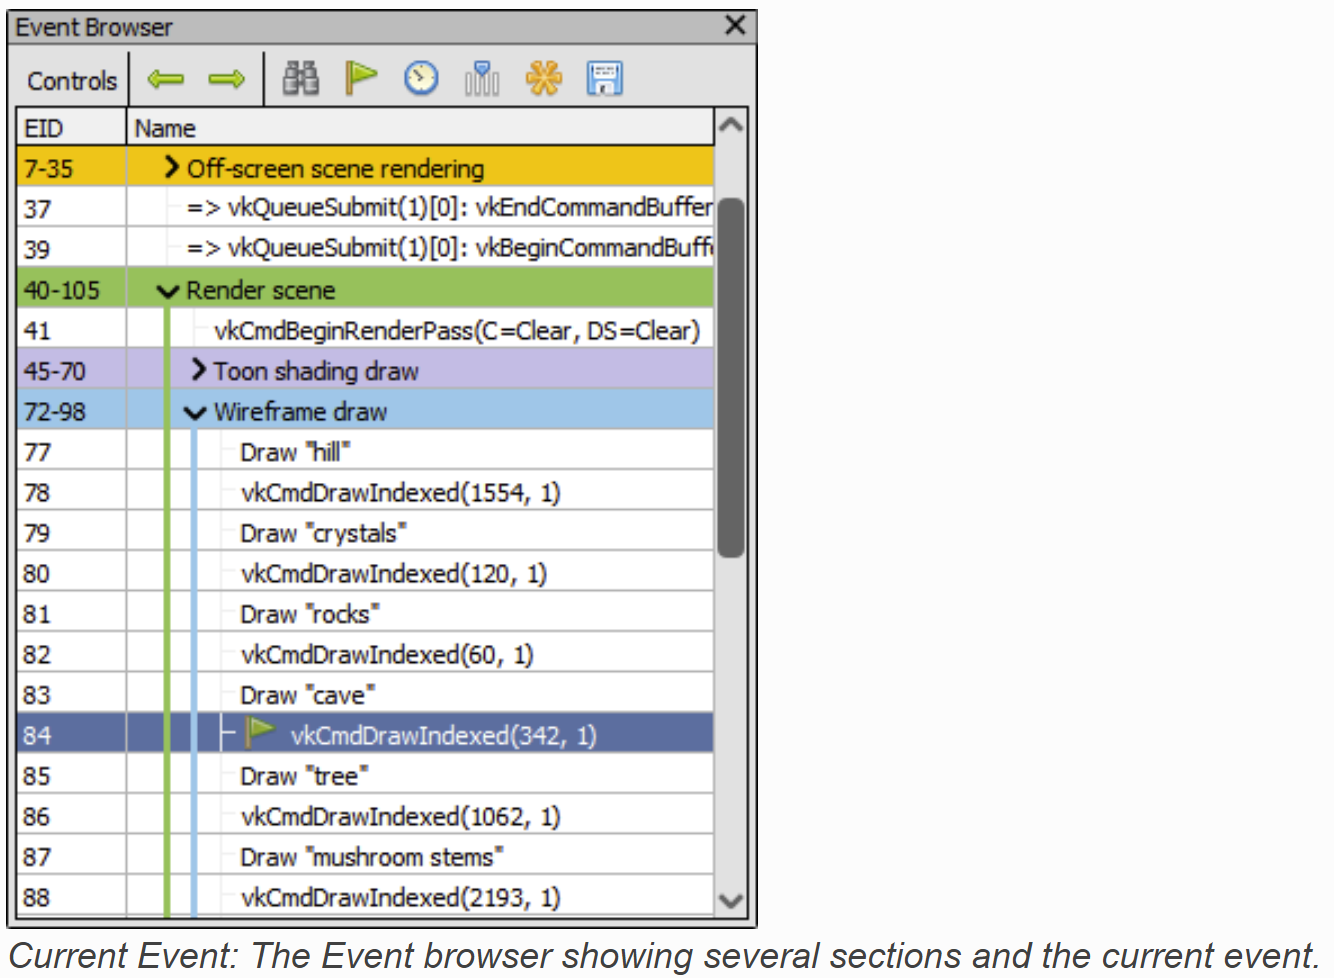
The EID column indicates the event ID of the drawcall listed. Event IDs are assigned starting from 1 and increase every time and API call is made - for this reason drawcall EIDs are not necessarily contiguous.
Simply clicking on a different event will select it as current, and selecting a parent node with some child events will acts as if the final child is selected - in other words selecting a node with serveral children will show the results of all children having happend.
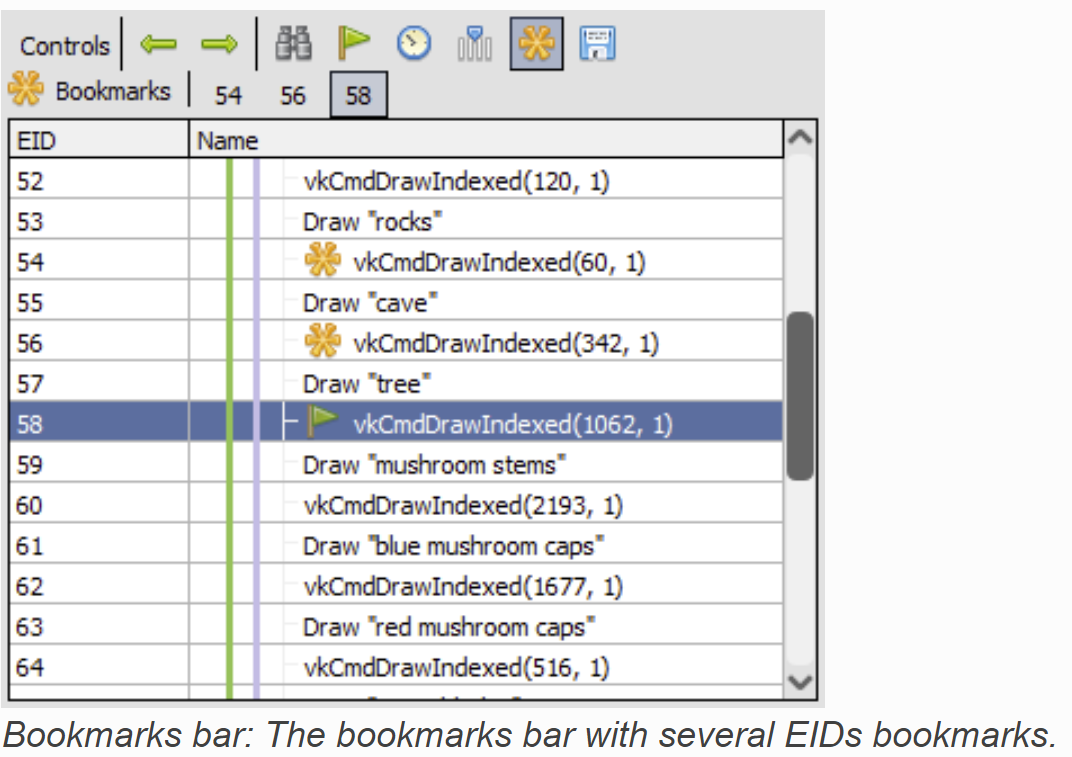
Bookmarks
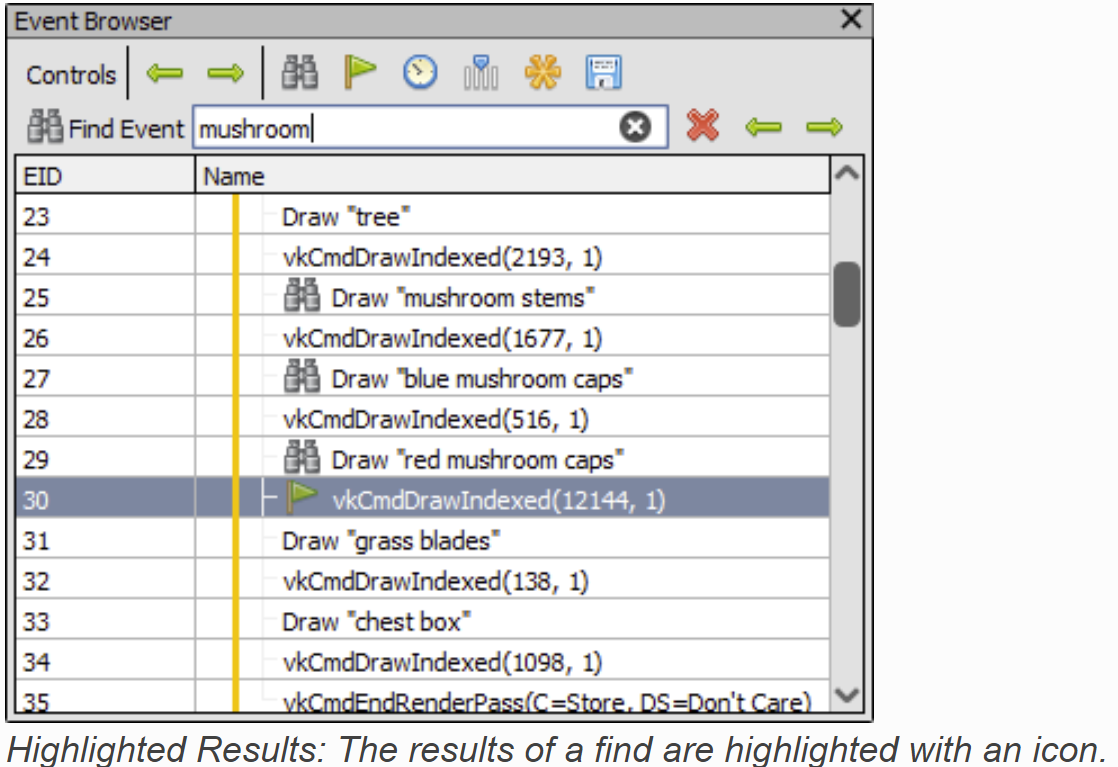
Searching and Jumping

Settings Window
Pipeline State
The Pipeline Viewer is an information dense but simple window in RenderDoc. It shows all of the stateful settings of the graphics pipeline, including bound resources, rasterize settings, etc.
Pipeline flowchart
At the top of the Pipeline Viewer is the pipeline flowchart - this shows the high-level block level diagram of the graphics pipeline
Each block is a separate page which contain the relevant state and contents for that piece of the graphics pipeline, with specific details varying by API and the type of data to be displayed
The currently selected block is outlined with red, and the page in view reflects the contents of that section of the pipeline. Light gray parts of the pipeline are those which are currently active and participating in this drawcall. Dark gray parts of the pipeline are not enabled and can be considered pass-through/do-nothing.

Pipeline Section Display
The pipeline state viewer always displays the state of the pipeline after the execution of the drawcall, as with the other viewers in RenderDoc
Any reousrces that are bound to the pipeline can be opened in more detailed viewers, such as vertex buffers, constant buffers and textures.
The pipeline view attempts to only show what is relevant, and not all possible stateful data. To do this(when available) it uses shader reflection data to only display slots which are actually in use by the shaders, and omit any that are unused.This can be overridden with the Show Unused Items button.
Shader Viewer

Timeline Bar
Capture Connection
Debug Messages
Python Shell
Resource Insepctor
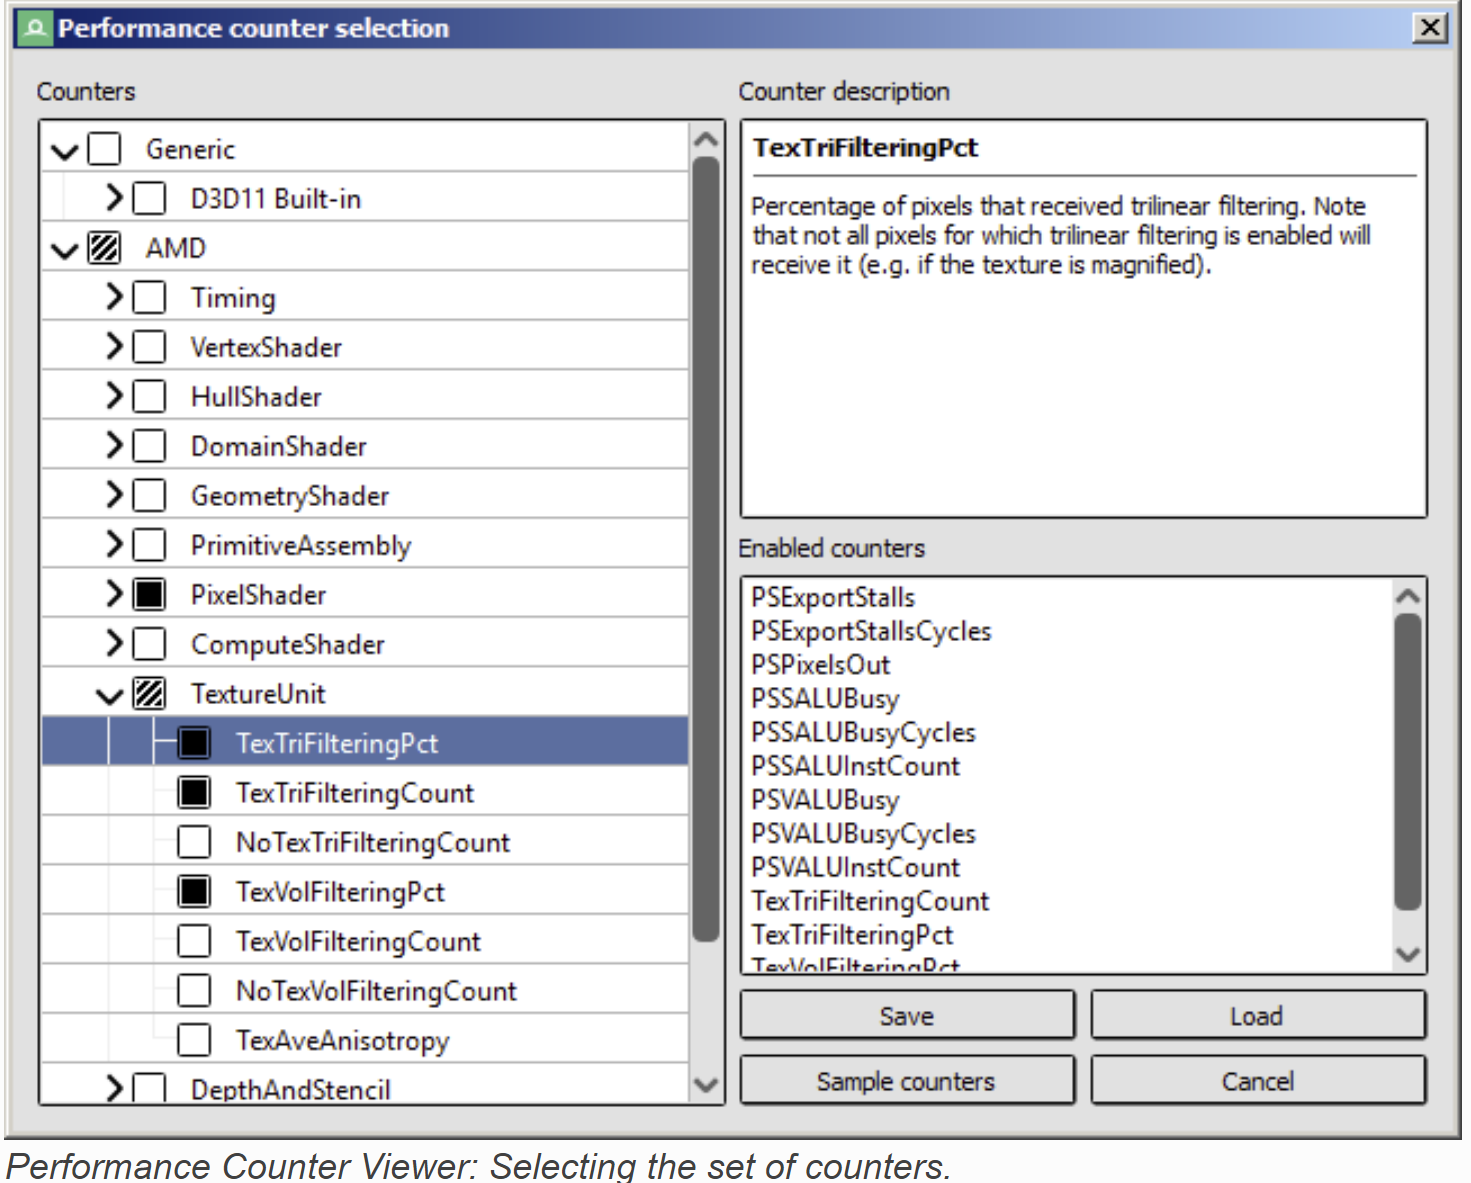
Performance Counter Viewer
The performance counter viewer providers a very simple way to fetch the results of GPU counters across all events in a capture
Counter selection
Counter Results

Hardware Counters
Capture Comments
Unity3D\2D手机游戏开发 学习的更多相关文章
- Unity3d/2d手机游戏开发第二版 (金玺曾) 随书资源
http://pan.baidu.com/s/1c0xpn4s Unity3d2d手机游戏开发配书资源文件.rar 1.36G 书上的链接坏掉了,我在论坛上面买了一份,放这分享给买了书找不到资源的同学 ...
- Android——Cocosd2d-x手机游戏开发学习思路
手机APP应用如雨后春笋般冒了出来,而在众多的APP应用中,游戏占据了半壁江山.它丰富着人们的业余生活,增进了人们之间的沟通交流.也有许多开发的朋友对游戏开发情有独钟,他们不止是享受着有很多的人们去下 ...
- Photon + Unity3D 线上游戏开发 学习笔记(一)
大家好. 我也是学习Photon + unity3D 的新手 有什么说错的地方大家见谅哈. 我的开发环境是 unity3D 4.1.3 , Visual Studio 是2010 版本号的 p ...
- Photon + Unity3D 线上游戏开发 学习笔记(四)
这一节 我们建立 photon Server 端的框架 一个最简单的Photon框架 就包括一个 Applocation 类 和 一个 peer 类,作用例如以下: * Application 类是 ...
- Photon + Unity3D 线上游戏开发 学习笔记(三)
好的,说了两篇了 如今我们正式的入手,揭开photon 的盖头哈 建立photon项目 第一步: 在Visual studio建立一个空的 待会为了測试也会在里面建立一个client 项目 (只 ...
- 学习手机游戏开发的两个方向 Cocos2d-x 和 Unity 3D/2D,哪个前景更好?
如题! 首先说一说学习手机游戏(移动游戏)这件事. 眼下移动互联网行业的在以井喷状态发展.全球几十亿人都持有智能终端设备(ios android),造就了非常多移动互联网创业机会: 一.移动社交 微信 ...
- 从一点儿不会开始——Unity3D游戏开发学习(一)
一些废话 我是一个windows phone.windows 8的忠实粉丝,也是一个开发者,开发数个windows phone应用和两个windows 8应用.对开发游戏一直抱有强烈兴趣和愿望,但奈何 ...
- Unity3D手机游戏开发
<Unity3D手机游戏开发> 基本信息 作者: 金玺曾 出版社:清华大学出版社 ISBN:9787302325550 上架时间:2013-8-7 出版日期:2013 年8月 开本:16开 ...
- Android安卓手机游戏开发
成都传智播客Java培训,免费学Android安卓手机游戏开发,安卓android开发课程包括Android安卓应用开发和Android安卓游戏开发两个方向,可是偏向游戏开发. 依据"199 ...
随机推荐
- VBA续嘘嘘——宏技巧集绵
什么是VBA?它有什么作用? A.实现Excel中没有实现的功能. B.提高运行速度. C.编写自定义函数. D.实现自动化功能. E.通过插入窗体做小型管理软件. VBA在哪里存放的?怎么运行? A ...
- 玩转X-CTR100 l STM32F4 l DAC数字模拟转换
我造轮子,你造车,创客一起造起来!塔克创新资讯[塔克社区 www.xtark.cn ][塔克博客 www.cnblogs.com/xtark/ ] 本文介绍X-CTR100控制器 DAC接口 ...
- DevExpress v18.1新版亮点——CodeRush for VS篇(二)
用户界面套包DevExpress v18.1日前正式发布,本站将以连载的形式为大家介绍各版本新增内容.本文将介绍了CodeRush for Visual Studio v18.1 的新功能,快来下载试 ...
- AngularJS输出helloworld
AngularJS是什么? AngularJS是目前很火的前端JS框架之一, AngularJS的开发团队将其描述为一种构建动态Web应用的结构化框架.它是完全使用JavaScript编写的客户端技术 ...
- Java基础复习
java语言的一个核心:jdk, java development kits---面向开发人员jre, java Runtime Environment---服务器上 java虚拟机---(以字节码为 ...
- 跳过用例skip
1.装饰器,放在函数前面,跳过用例 @pytest.mark.skip(reason="no way of currently testing this") import pyte ...
- python分析nginx自定义日志
# -*- coding:utf-8 -*- import datetimeimport re logfile = '''192.168.23.43 - 2017-12-14:00:14:41 /se ...
- mysql引擎事物支持
事务的特性事务具体四大特性,也就是经常说的ACID 1. 原子性(Atomicity) 原子性是指事务包含的所有操作要么全部成功,要么全部失败回滚,因此事务的操作如果成功就必须要完全应用到数据库,如果 ...
- python 爬虫数据处理字符串时间转换格式方法
startDate = "2018-10-01"endDate = "2018-10-31" ###字符转化为日期startTime = datetime.da ...
- Python 类变量
class Person: country = "大清" def __init__(self, name, gender): self.name = name self.gende ...