windows内存debug技巧
A) c++ memory/heap corrupt debug 技巧
1. catch first exception
2. data breakpoint
VC tell us some address is corrupt when free some pointer
Check which pointer it is
Set break point when malloc the pointer
Set data breakpoint at the corrupt address after the pointer is malloc
VC will break at the place which corrupts memory
3. application verifier heap check 功能
4.
B) c++ memory leakage
注:需要管理员权限(gflags需要),能上网(会自动下载symbols)
主要有几个需求
一是dump leakage,可以用1,3实现
二是显示leakage的call stack,可以用1,2实现
而2的用法是比较两次快照,1可以在程序退出时做
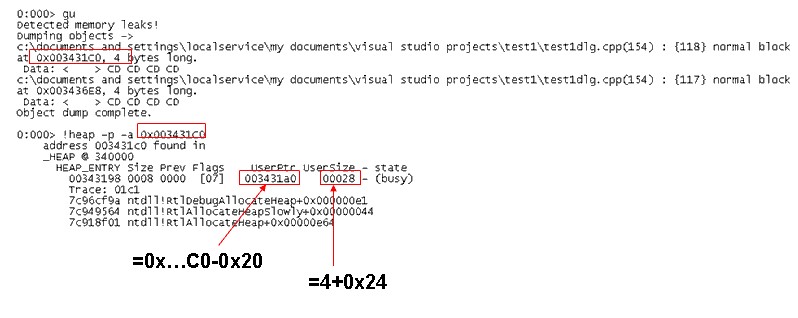
1. windbg
set _NT_SYMBOL_PATH=SRV*C:\MyLocalSymbols*http://msdl.microsoft.com/download/symbols
run gflags to enable the stack trace of the program
start the program
start windbg and attach to the program
bm wineagle!_CrtDumpMemoryLeaks
make the program leak memory
exit program
the program will break into windbg
step out by gu command
!heap -p -a <ADDR> where ADDR is the dumped leakage address
2. umdh
set _NT_SYMBOL_PATH=SRV*C:\MyLocalSymbols*http://msdl.microsoft.com/download/symbols
Gflags to enable OS log stack trace
restart the debugee program
-1- umdh.exe -pn:application_name.exe -f:FirstDump.txt
-2- ... exercise the application
-3- umdh.exe -pn:application_name.exe -f:SecondDump.txt
-4- umdh.exe FirstDump.txt SecondDump.txt -f:Result.txt
Compares allocations from the two dumps.
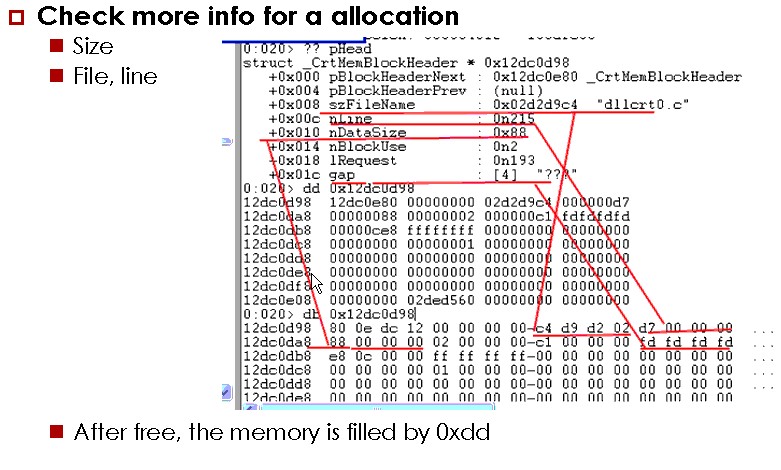
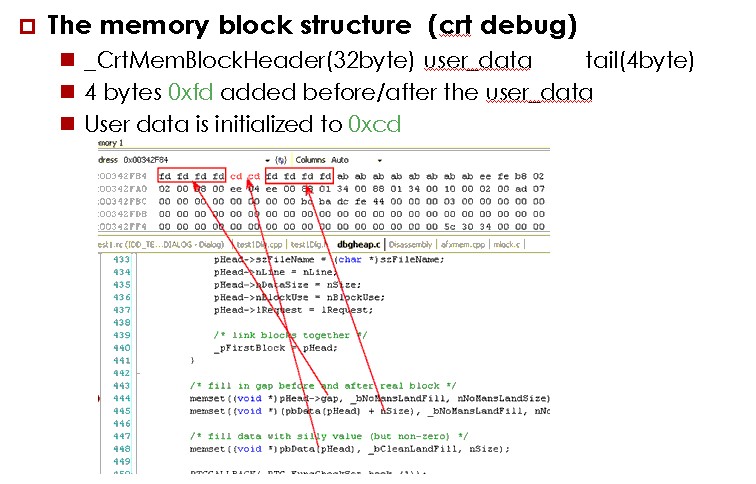
3. vc crt lib dump leakage
C) crt内存结构
Crt: _CrtSetDbgFlag, _CrtCheckMemory
D)关于gflags的heap类型
Gflags:
Full-page heap: placing a non-accessible page at the end of the allocation
Normal page heap: It checks fill patterns when a heap block is freed
Advantage: reduces memory consumption
Disadvantage
E) windbg extension
http://www.codeproject.com/Articles/6522/Debug-Tutorial-Part-4-Writing-WINDBG-Extensions
http://www.haogongju.net/art/1428822
??Debugging Tools for Windows, ?%programfiles%\ Debugging Tools for Windows (x86)\sdk????.
??:
Sdk\inc: ?????
??Dump???Callstack,??windbg???????
Sdk\lib:?????,dbghelp.lib,dbgeng.lib,engextcpp.lib,??????????
??Dump???Callstack,??windbg???????
Sdk\samples: samples(???????)
??Dump???Callstack,??windbg???????
Sdk\help:????
F)
Windows Performance Analyzer
http://msdn.microsoft.com/en-us/library/windows/desktop/ff190971%28v=vs.85%29.aspx
Write a debugger
http://social.msdn.microsoft.com/Forums/en-US/netfxbcl/thread/90770a1c-7f83-4f81-864f-e64f3e17d02b
You can use mdbg as a model for a debugger implementation, it comes with source code and you will find a lot of references about it . Depending on the type of debugging you want to do there are two APIs you can use: - for native applications you should use the native debugging API :爃ttp://msdn.microsoft.com/en-us/library/ms679304(VS.85).aspx
- for managed applications the managed debugging API :爃ttp://msdn.microsoft.com/en-us/library/ms404520.aspx
Both come with samples, for example this (http://msdn.microsoft.com/en-us/library/ms679288(VS.85).aspx) is an example of building a basic debugger using the native API. I also recommend Mike Stall's debugging blog爃ttp://blogs.msdn.com/jmstall/default.aspx.
Creating a Basic Debugger
http://msdn.microsoft.com/en-us/library/ms679288%28VS.85%29.aspx
Sample code for PDB 2 XML tool
http://blogs.msdn.com/b/jmstall/archive/2005/08/25/sample-pdb2xml.aspx
Tool to get snapshot of managed callstacks
http://blogs.msdn.com/b/jmstall/archive/2005/11/28/snapshot.aspx
windows内存debug技巧的更多相关文章
- gdb调试的艺术——Debug技巧
调试的艺术——Debug技巧总结 (本文从写好的wiki里粘出来的,格式稍乱不影响阅读) 用Q+编号代表问题,A+编号代表答案.用这种方式组织.如无特别说明,这些技巧都是针对Visual Studio ...
- 玩转Windows服务系列——Windows服务小技巧
伴随着研究Windows服务,逐渐掌握了一些小技巧,现在与大家分享一下. 将Windows服务转变为控制台程序 由于默认的Windows服务程序,编译后为Win32的窗口程序.我们在程序启动或运行过程 ...
- 玩转Windows服务系列——Windows服务小技巧
原文:玩转Windows服务系列——Windows服务小技巧 伴随着研究Windows服务,逐渐掌握了一些小技巧,现在与大家分享一下. 将Windows服务转变为控制台程序 由于默认的Windows服 ...
- Windows服务小技巧
Windows服务小技巧 阅读目录 开始 将Windows服务转变为控制台程序 注册服务为自动启动服务 注册服务时设置服务的依赖关系 添加自定义命令行参数 自定义命令行参数演示 系列链接 伴随着研究W ...
- 全面介绍Windows内存管理机制及C++内存分配实例(四):内存映射文件
本文背景: 在编程中,很多Windows或C++的内存函数不知道有什么区别,更别谈有效使用:根本的原因是,没有清楚的理解操作系统的内存管理机制,本文企图通过简单的总结描述,结合实例来阐明这个机制. 本 ...
- 全面介绍Windows内存管理机制及C++内存分配实例
转自:http://blog.csdn.net/yeming81/article/details/2046193 本文基本上是windows via c/c++上的内容,笔记做得不错.. 本文背景: ...
- 第13章 Windows内存体系结构
13.1 Windows的虚拟地址空间安排 13.1.1虚拟地址空间的分区(即虚拟地址空间布局) 进程的地址空间划分 分区 x86 32位 Windows 3GB用户模式下的x86 32位Window ...
- Windows内存管理和linux内存管理
windows内存管理 windows 内存管理方式主要分为:页式管理,段式管理,段页式管理. 页式管理的基本原理是将各进程的虚拟空间划分为若干个长度相等的页:页式管理把内存空间按照页的大小划分成片或 ...
- windows内存映射学习及帮助类实现
本文通过创建文件内存映射类,学习windows内存映射相关知识:创建内存映射文件后,可以按照内存操作方式操作文件:支持32位程序处理超过4G大小的文件. 感谢http://blog.csdn.net/ ...
随机推荐
- TED #07# How to inspire every child to be a lifelong reader
Alvin Irby: How to inspire every child to be a lifelong reader Prepare elementarykitchen tableforced ...
- 20145326《Java程序设计》第二周学习总结
20145326<Java程序设计>第二周学习总结 教材学习内容总结 本周学习教材第三章,本章主要讲述了java语言中的一些基础语法,java是个支持面向对象的程序语言,但在正式进入面向对 ...
- ngular6开发不完全笔记(三)-- 报错指南
router Uncaught Error: Template parse errors: 'router-outlet' is not a known element: If 'router-out ...
- ThinkPHP开发博客系统笔记之一
1.前后台搭建 开发的第一步是搭建前后台系统.搭建前台系统的时候新建了LoginController控制器和登录界面View/Login/index.tpl.模板文件中需要引入js和css文件,这里想 ...
- UTF-8里包括GB2312
用最易懂的说法就是UTF-8里包括GB2312.UTF-8是国际通用的标准(包括世界所有的语言),而GB2312(只是简体中文)只适合做中文的网站. 假设你想做个中文网页,但是还可以翻成英文的话,就得 ...
- JavaScript返回上一页和返回上一级页面并刷新
JavaScript返回上一页和刷新当前页 window.history.go(-1); //返回上一页 window.history.back(); //返回上一页 //如果要强行刷新的话就是:wi ...
- Linux命令详解-info
info是一种文档格式,也是阅读此格式文档的阅读器:我们常用它来查看Linux命令的info文档.它以主题的形式把几个命令组织在一起,以便于我们阅读:在主题内以node(节点)的形式把本主题的几个命令 ...
- HDU 4540 线性DP
威威猫系列故事——打地鼠 Time Limit: 300/100 MS (Java/Others) Memory Limit: 65535/32768 K (Java/Others)Total ...
- IOS-高仿bilibili项目
高仿bilibili项目成长之路 (logo) 高仿bilibili项目 Github链接:(https://github.com/MichaelHuyp/Bilibili_Wuxianda) 目前完 ...
- python学习笔记(三)---python关键字及其用法
转载出处:https://www.cnblogs.com/ECJTUACM-873284962/p/7576959.html 前言 最近在学习Java Sockst的时候遇到了一些麻烦事,我觉得我很有 ...