Machine learning 第8周编程作业 K-means and PCA
1.findClosestCentroids
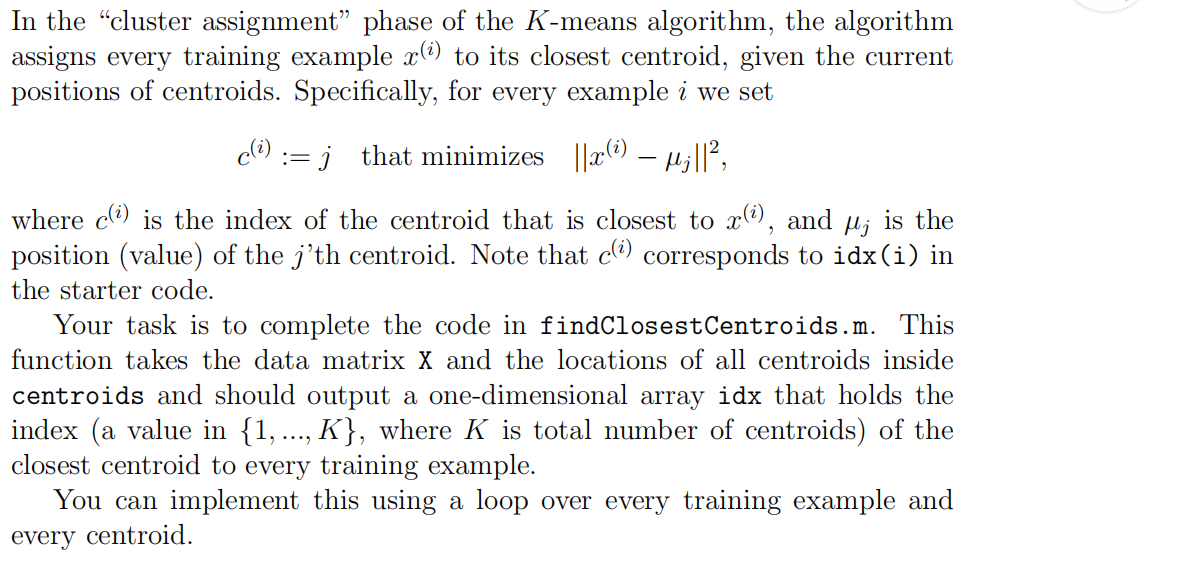
function idx = findClosestCentroids(X, centroids)

%FINDCLOSESTCENTROIDS computes the centroid memberships for every example

%   idx = FINDCLOSESTCENTROIDS (X, centroids) returns the closest centroids

%   in idx for a dataset X where each row is a single example. idx = m x 1

%   vector of centroid assignments (i.e. each entry in range [1..K])

%

% Set K

K = size(centroids, 1);

% You need to return the following variables correctly.

idx = zeros(size(X,1), 1);

% ====================== YOUR CODE HERE ======================

% Instructions: Go over every example, find its closest centroid, and store

%               the index inside idx at the appropriate location.

%               Concretely, idx(i) should contain the index of the centroid

%               closest to example i. Hence, it should be a value in the

%               range 1..K

%

% Note: You can use a for-loop over the examples to compute this.

%

for i=1:size(X,1),

  for j=1:K,

    dis(j)=sum( (centroids(j,:)-X(i,:)).^2, 2 );

  endfor

  [t,idx(i)]=min(dis);

endfor

% =============================================================

end
2.computerCentroids

function centroids = computeCentroids(X, idx, K)

%COMPUTECENTROIDS returns the new centroids by computing the means of the

%data points assigned to each centroid.

%   centroids = COMPUTECENTROIDS(X, idx, K) returns the new centroids by

%   computing the means of the data points assigned to each centroid. It is

%   given a dataset X where each row is a single data point, a vector

%   idx of centroid assignments (i.e. each entry in range [1..K]) for each

%   example, and K, the number of centroids. You should return a matrix

%   centroids, where each row of centroids is the mean of the data points

%   assigned to it.

%

% Useful variables

[m n] = size(X);

% You need to return the following variables correctly.

centroids = zeros(K, n);

% ====================== YOUR CODE HERE ======================

% Instructions: Go over every centroid and compute mean of all points that

%               belong to it. Concretely, the row vector centroids(i, :)

%               should contain the mean of the data points assigned to

%               centroid i.

%

% Note: You can use a for-loop over the centroids to compute this.

%

for i=1:K,

  ALL=0;

  cnt=sum(idx==i);

  temp=find(idx==i);

  for j=1:numel(temp),

    ALL=ALL+X(temp(j),:);

  endfor

  centroids(i,:)=ALL/cnt;

endfor

% =============================================================

end
3.pca
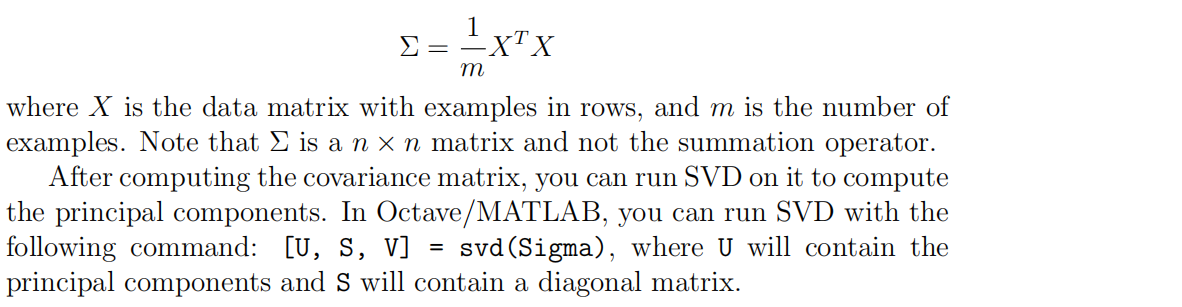
function [U, S] = pca(X)

%PCA Run principal component analysis on the dataset X

%   [U, S, X] = pca(X) computes eigenvectors of the covariance matrix of X

%   Returns the eigenvectors U, the eigenvalues (on diagonal) in S

%

% Useful values

[m, n] = size(X);

% You need to return the following variables correctly.

U = zeros(n);

S = zeros(n);

% ====================== YOUR CODE HERE ======================

% Instructions: You should first compute the covariance matrix. Then, you

%               should use the "svd" function to compute the eigenvectors

%               and eigenvalues of the covariance matrix.

%

% Note: When computing the covariance matrix, remember to divide by m (the

%       number of examples).

%

Sigma=(X'*X)./m;

[U,S,V]=svd(Sigma);

% =========================================================================

end
4.projectData
function Z = projectData(X, U, K)

%PROJECTDATA Computes the reduced data representation when projecting only

%on to the top k eigenvectors

%   Z = projectData(X, U, K) computes the projection of

%   the normalized inputs X into the reduced dimensional space spanned by

%   the first K columns of U. It returns the projected examples in Z.

%

% You need to return the following variables correctly.

Z = zeros(size(X, 1), K);

% ====================== YOUR CODE HERE ======================

% Instructions: Compute the projection of the data using only the top K

%               eigenvectors in U (first K columns).

%               For the i-th example X(i,:), the projection on to the k-th

%               eigenvector is given as follows:

%                    x = X(i, :)';

%                    projection_k = x' * U(:, k);

%

U_reduce=U(:,1:K);

Z=X*U_reduce;

% =============================================================

end
5.recoverData
function X_rec = recoverData(Z, U, K)

%RECOVERDATA Recovers an approximation of the original data when using the

%projected data

%   X_rec = RECOVERDATA(Z, U, K) recovers an approximation the

%   original data that has been reduced to K dimensions. It returns the

%   approximate reconstruction in X_rec.

%

% You need to return the following variables correctly.

X_rec = zeros(size(Z, 1), size(U, 1));

% ====================== YOUR CODE HERE ======================

% Instructions: Compute the approximation of the data by projecting back

%               onto the original space using the top K eigenvectors in U.

%

%               For the i-th example Z(i,:), the (approximate)

%               recovered data for dimension j is given as follows:

%                    v = Z(i, :)';

%                    recovered_j = v' * U(j, 1:K)';

%

%               Notice that U(j, 1:K) is a row vector.

%

X_rec=Z*U(:,1:K)';

% =============================================================

end
Machine learning 第8周编程作业 K-means and PCA的更多相关文章
- Machine learning 第7周编程作业 SVM
1.Gaussian Kernel function sim = gaussianKernel(x1, x2, sigma) %RBFKERNEL returns a radial basis fun ...
- Machine learning第6周编程作业
1.linearRegCostFunction: function [J, grad] = linearRegCostFunction(X, y, theta, lambda) %LINEARREGC ...
- Machine learning 第5周编程作业
1.Sigmoid Gradient function g = sigmoidGradient(z) %SIGMOIDGRADIENT returns the gradient of the sigm ...
- Machine learning第四周code 编程作业
1.lrCostFunction: 和第三周的那个一样的: function [J, grad] = lrCostFunction(theta, X, y, lambda) %LRCOSTFUNCTI ...
- c++ 西安交通大学 mooc 第十三周基础练习&第十三周编程作业
做题记录 风影影,景色明明,淡淡云雾中,小鸟轻灵. c++的文件操作已经好玩起来了,不过掌握好控制结构显得更为重要了. 我这也不做啥题目分析了,直接就题干-代码. 总结--留着自己看 1. 流是指从一 ...
- 吴恩达深度学习第4课第3周编程作业 + PIL + Python3 + Anaconda环境 + Ubuntu + 导入PIL报错的解决
问题描述: 做吴恩达深度学习第4课第3周编程作业时导入PIL包报错. 我的环境: 已经安装了Tensorflow GPU 版本 Python3 Anaconda 解决办法: 安装pillow模块,而不 ...
- 吴恩达深度学习第2课第2周编程作业 的坑(Optimization Methods)
我python2.7, 做吴恩达深度学习第2课第2周编程作业 Optimization Methods 时有2个坑: 第一坑 需将辅助文件 opt_utils.py 的 nitialize_param ...
- Machine Learning - 第7周(Support Vector Machines)
SVMs are considered by many to be the most powerful 'black box' learning algorithm, and by posing构建 ...
- Machine Learning – 第2周(Linear Regression with Multiple Variables、Octave/Matlab Tutorial)
Machine Learning – Coursera Octave for Microsoft Windows GNU Octave官网 GNU Octave帮助文档 (有900页的pdf版本) O ...
随机推荐
- 2018.10.02 NOIP模拟 序列维护(线段树+广义欧拉定理)
传送门 一道比较好的线段树. 考试时线性筛打错了于是弃疗. 60分暴力中有20分的快速幂乘爆了于是最后40分滚粗. 正解并不难想. 每次区间加打懒标记就行了. 区间查询要用到广义欧拉定理. 我们会发现 ...
- MySQL 的IFNULL()、ISNULL()和NULLIF()函数
参考与http://blog.csdn.net/xingyu0806/article/details/52080962 IFNULL(expr1,expr2) 假如expr1不为NULL,则 IFNU ...
- org.eclipse.ui.PartInitException: Unable to open editor, unknown editor ID: org.xmen.ui.text.XMLTextEditor
无法打开struts模式的编译xml的编译器,然后打开.project文件,编辑最后一行,找到<natures>结点,增加一条<nature>com.genuitec.ecli ...
- 新浪微博mid和url的互算
我们在使用新浪微博API时,有时需要得到一个微博的url,但是如statuses/public_timeline等接口中取得的微博status的字段中并没有包含.不过,status中包含了一个mid字 ...
- _variant_t与其他数据类型的转换
转自:http://kuaixingdong.blog.hexun.com/29627840_d.html 我们先看看COM所支持的一些类型的基本类: (微软提供,在comdef.h中定义) 在COM ...
- bootstrap实现左侧图片右侧文字布局
效果图 代码 通过class="media-left"来控制相对位置 <!DOCTYPE html> <html> <head lang=" ...
- 拒绝“高冷”词汇!初学C#中实用的泛型!
初学C#,整天对着业务逻辑,写反反复复的“过程型”代码逻辑十分枯燥,不如用点新东西提升一下代码效率,让代码看起来更有逼格?! 好,下面我们看看C#中简单易学的泛型. 首先,我写了一个这样的方法 --- ...
- 实例化MD5CryptoServiceProvider报错:此实现不是 Windows 平台 FIPS 验证的加密算法的一部分
System.InvalidOperationException: This implementation is not part of the Windows Platform FIPS valid ...
- 构建NetCore应用框架之实战篇(四):BitAdminCore框架1.0登录功能细化及技术选型
本篇承接上篇内容,如果你不小心点击进来,建议从第一篇开始完整阅读,文章内容继承性连贯性. 构建NetCore应用框架之实战篇系列 一.BitAdminCore框架1.0版本 1.1.0版本是指最小版本 ...
- STM32F4时钟配置库函数详解
在STM32中,所有的应用都是基于时钟,所以时钟的配置就尤为重要了,而不能仅仅只知道使用默认时钟. STM32F4的时钟树如上图所示,HSE为外部接入的一个8M的时钟,然后再给PLL提供输入时钟,经过 ...