吴裕雄 python 机器学习——局部线性嵌入LLE降维模型
# -*- coding: utf-8 -*-

import numpy as np

import matplotlib.pyplot as plt

from sklearn import datasets,manifold

def load_data():

    '''

    加载用于降维的数据

    '''

    # 使用 scikit-learn 自带的 iris 数据集

    iris=datasets.load_iris()

    return  iris.data,iris.target

#局部线性嵌入LLE降维模型

def test_LocallyLinearEmbedding(*data):

    X,y=data

    # 依次考察降维目标为 4维、3维、2维、1维

    for n in [4,3,2,1]:

        lle=manifold.LocallyLinearEmbedding(n_components=n)

        lle.fit(X)

        print('reconstruction_error(n_components=%d) : %s'%(n, lle.reconstruction_error_))

# 产生用于降维的数据集

X,y=load_data()

# 调用 test_LocallyLinearEmbedding

test_LocallyLinearEmbedding(X,y)

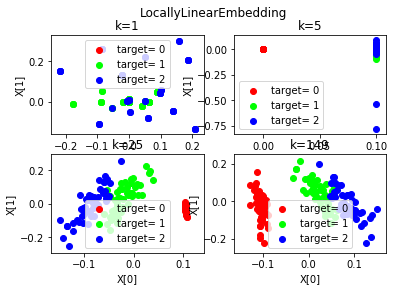
def plot_LocallyLinearEmbedding_k(*data):

    '''

    测试 LocallyLinearEmbedding 中 n_neighbors 参数的影响,其中降维至 2维

    '''

    X,y=data

    # n_neighbors参数的候选值的集合

    Ks=[1,5,25,y.size-1]

    fig=plt.figure()

    for i, k in enumerate(Ks):

        lle=manifold.LocallyLinearEmbedding(n_components=2,n_neighbors=k)

        #原始数据集转换到二维

        X_r=lle.fit_transform(X)

        ## 两行两列,每个单元显示不同 n_neighbors 参数的 LocallyLinearEmbedding 的效果图

        ax=fig.add_subplot(2,2,i+1)

        # 颜色集合,不同标记的样本染不同的颜色

        colors=((1,0,0),(0,1,0),(0,0,1),(0.5,0.5,0),(0,0.5,0.5),(0.5,0,0.5),(0.4,0.6,0),(0.6,0.4,0),(0,0.6,0.4),(0.5,0.3,0.2))

        for label ,color in zip( np.unique(y),colors):

            position=y==label

            ax.scatter(X_r[position,0],X_r[position,1],label="target= %d"%label,color=color)

        ax.set_xlabel("X[0]")

        ax.set_ylabel("X[1]")

        ax.legend(loc="best")

        ax.set_title("k=%d"%k)

    plt.suptitle("LocallyLinearEmbedding")

    plt.show()

# 调用 plot_LocallyLinearEmbedding_k

plot_LocallyLinearEmbedding_k(X,y)
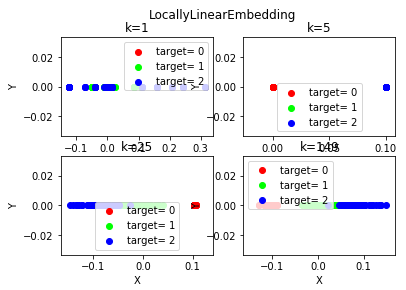
def plot_LocallyLinearEmbedding_k_d1(*data):

    '''

    测试 LocallyLinearEmbedding 中 n_neighbors 参数的影响,其中降维至 1维

    '''

    X,y=data

    Ks=[1,5,25,y.size-1]# n_neighbors参数的候选值的集合

    fig=plt.figure()

    for i, k in enumerate(Ks):

        lle=manifold.LocallyLinearEmbedding(n_components=1,n_neighbors=k)

        X_r=lle.fit_transform(X)#原始数据集转换到 1 维

        ax=fig.add_subplot(2,2,i+1)## 两行两列,每个单元显示不同 n_neighbors 参数的 LocallyLinearEmbedding 的效果图

        colors=((1,0,0),(0,1,0),(0,0,1),(0.5,0.5,0),(0,0.5,0.5),(0.5,0,0.5),

            (0.4,0.6,0),(0.6,0.4,0),(0,0.6,0.4),(0.5,0.3,0.2),)# 颜色集合,不同标记的样本染不同的颜色

        for label ,color in zip( np.unique(y),colors):

            position=y==label

            ax.scatter(X_r[position],np.zeros_like(X_r[position]),

            label="target= %d"%label,color=color)

        ax.set_xlabel("X")

        ax.set_ylabel("Y")

        ax.legend(loc="best")

        ax.set_title("k=%d"%k)

    plt.suptitle("LocallyLinearEmbedding")

    plt.show()

# 调用 plot_LocallyLinearEmbedding_k_d1

plot_LocallyLinearEmbedding_k_d1(X,y)
吴裕雄 python 机器学习——局部线性嵌入LLE降维模型的更多相关文章
- 吴裕雄 python 机器学习——等度量映射Isomap降维模型
# -*- coding: utf-8 -*- import numpy as np import matplotlib.pyplot as plt from sklearn import datas ...
- 吴裕雄 python 机器学习——支持向量机线性分类LinearSVC模型
import numpy as np import matplotlib.pyplot as plt from sklearn import datasets, linear_model,svm fr ...
- 吴裕雄 python 机器学习——人工神经网络与原始感知机模型
import numpy as np from matplotlib import pyplot as plt from mpl_toolkits.mplot3d import Axes3D from ...
- 吴裕雄 python 机器学习——主成份分析PCA降维
# -*- coding: utf-8 -*- import numpy as np import matplotlib.pyplot as plt from sklearn import datas ...
- 吴裕雄 python 机器学习——多项式贝叶斯分类器MultinomialNB模型
import numpy as np import matplotlib.pyplot as plt from sklearn import datasets,naive_bayes from skl ...
- 吴裕雄 python 机器学习——数据预处理二元化OneHotEncoder模型
from sklearn.preprocessing import OneHotEncoder #数据预处理二元化OneHotEncoder模型 def test_OneHotEncoder(): X ...
- 吴裕雄 python 机器学习——数据预处理二元化Binarizer模型
from sklearn.preprocessing import Binarizer #数据预处理二元化Binarizer模型 def test_Binarizer(): X=[[1,2,3,4,5 ...
- 吴裕雄 python 机器学习——集成学习AdaBoost算法回归模型
import numpy as np import matplotlib.pyplot as plt from sklearn import datasets,ensemble from sklear ...
- 吴裕雄 python 机器学习——集成学习AdaBoost算法分类模型
import numpy as np import matplotlib.pyplot as plt from sklearn import datasets,ensemble from sklear ...
随机推荐
- 《深入理解java虚拟机》读书笔记一——第二章
第二章 Java内存区域与内存溢出异常 1.运行时数据区域 程序计数器: 当前线程所执行的字节码的行号指示器,用于存放下一条需要运行的指令. 运行速度最快位于处理器内部. 线程私有. 虚拟机栈: 描述 ...
- SQL四种语言:DDL,DML,DCL,TCL 的区别
1.DDL(Data Definition Language)数据库定义语言statements are used to define the database structure or schema ...
- JS图片轮换
<!DOCTYPE html> <html> <head> <meta charset="UTF-8"> <title> ...
- python之路模块
time模块 print time.time() print time.mktime(time.localtime()) print time.gmtime() #可加时间戳参数 print time ...
- 1.spring异常:Caused by: java.lang.NoClassDefFoundError: org/aopalliance/intercept/MethodInterceptor
org.springframework.beans.factory.BeanCreationException: Error creating bean with name 'org.springfr ...
- ubuntu18 + caffe+cpu+anaconda3
本记录只暂时只记录一些错误. 编译错误,opencv3.2与anaconda3下的libtiff不兼容,冲突. 问题查找(查找所有的TIFF库与编译错误提示匹配/usr/lib/x86_64-linu ...
- iOS13禁用深色模式
全局禁用深色模式(暗黑模式)在Info.plist中增加UIUserInterfaceStyle,值为Light,如下 <key>UIUserInterfaceStyle</key& ...
- mybatis-plus QueryWrapper自定义查询条件
mybatis-plus QueryWrapper自定义查询条件 mybatis-plus框架功能很强大,把很多功能都集成了,比如自动生成代码结构,mybatis crud封装,分页,动态数据源等等, ...
- Oracle允许IP访问配置
http://www.linuxidc.com/Linux/2014-10/108650.htm 1.oracle服务器下/opt/app/oracle/product/11.2.0/network/ ...
- k线、指标绘制
我接触的绘制有两种:gdi+和qt绘图.可以灵活的绘制任何想要的东西. 先上效果图吧. 如下:基于gdi+的股指和股票的绘制.上面是沪深成分股实时生成的股票指数走势,下面是IF主力走势和开平仓位置. ...