sklearn中的数据预处理----good!! 标准化 归一化 在何时使用
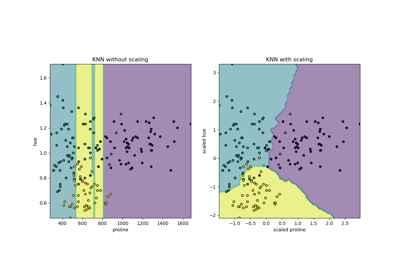
RESCALING attribute data to values to scale the range in [0, 1] or [−1, 1] is useful for the optimization algorithms, such as gradient descent, that are used within machine learning algorithms that weight inputs (e.g. regression and neural networks). Rescaling is also used for algorithms that use distance measurements for example K-Nearest-Neighbors (KNN). Rescaling like this is sometimes called "normalization". MinMaxScaler class in python skikit-learn does this.
NORMALIZING attribute data is used to rescale components of a feature vector to have the complete vector length of 1. This is "scaling by unit length". This usually means dividing each component of the feature vector by the Euclidiean length of the vector but can also be Manhattan or other distance measurements. This pre-processing rescaling method is useful for sparse attribute features and algorithms using distance to learn such as KNN. Python scikit-learn Normalizer class can be used for this.
STANDARDIZING attribute data is also a preprocessing method but it assumes a Gaussian distribution of input features. It "standardizes" to a mean of 0 and a standard deviation of 1. This works better with linear regression, logistic regression and linear discriminate analysis. Python StandardScaler class in scikit-learn works for this.
from:skearn DOC:
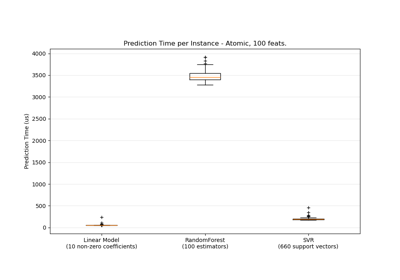
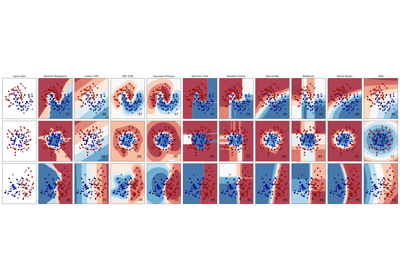
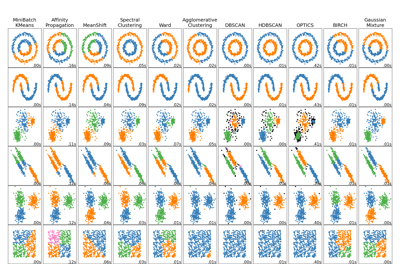
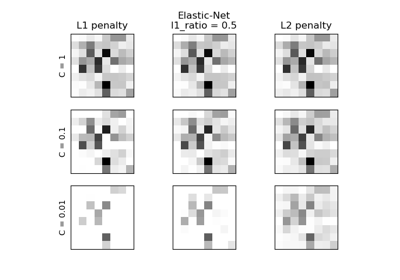
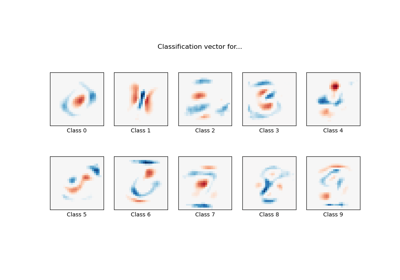
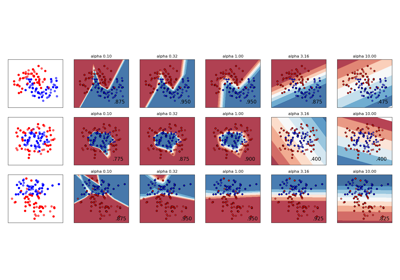
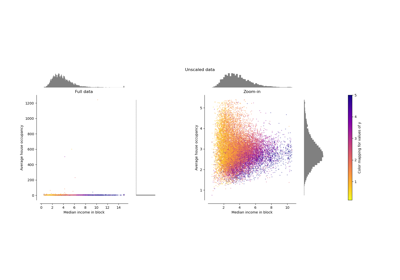
Examples using sklearn.preprocessing.StandardScaler
from:https://www.programcreek.com/python/example/82501/sklearn.preprocessing.MinMaxScaler-----maybe svm is wrong!
Python sklearn.preprocessing.MinMaxScaler() Examples
The following are 50 code examples for showing how to use sklearn.preprocessing.MinMaxScaler(). They are extracted from open source Python projects. You can vote up the examples you like or vote down the exmaples you don't like. You can also save this page to your account.
| Project: sef Author: passalis File: classification.py View Source Project | 7 votes |   |
def evaluate_svm(train_data, train_labels, test_data, test_labels, n_jobs=-1):

    """

    Evaluates a representation using a Linear SVM

    It uses 3-fold cross validation for selecting the C parameter

    :param train_data:

    :param train_labels:

    :param test_data:

    :param test_labels:

    :param n_jobs:

    :return: the test accuracy

    """

    # Scale data to 0-1

    scaler = MinMaxScaler()

    train_data = scaler.fit_transform(train_data)

    test_data = scaler.transform(test_data)

    parameters = {'kernel': ['linear'], 'C': [0.0001, 0.001, 0.01, 0.1, 1, 10, 100, 1000, 10000, 100000]}

    model = svm.SVC(max_iter=10000)

    clf = grid_search.GridSearchCV(model, parameters, n_jobs=n_jobs, cv=3)

    clf.fit(train_data, train_labels)

    lin_svm_test = clf.score(test_data, test_labels)

    return lin_svm_test
| Project: golden_touch Author: at553 File: predict.py View Source Project | 6 votes | |
def train_model(self):

        # scale

        scaler = MinMaxScaler(feature_range=(0, 1))

        dataset = scaler.fit_transform(self.data)

        # split into train and test sets

        train_size = int(len(dataset) * 0.95)

        train, test = dataset[0:train_size, :], dataset[train_size:len(dataset), :]

        look_back = 5

        trainX, trainY = self.create_dataset(train, look_back)

        # reshape input to be [samples, time steps, features]

        trainX = numpy.reshape(trainX, (trainX.shape[0], 1, trainX.shape[1]))

        # create and fit the LSTM network

        model = Sequential()

        model.add(LSTM(6, input_dim=look_back))

        model.add(Dense(1))

        model.compile(loss='mean_squared_error', optimizer='adam')

        model.fit(trainX, trainY, nb_epoch=100, batch_size=1, verbose=2)

        return model
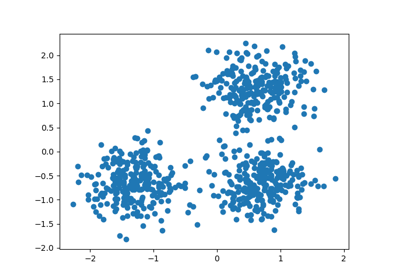
官方的dbscan聚类使用 StandardScaler
http://scikit-learn.org/stable/auto_examples/cluster/plot_dbscan.html#example-cluster-plot-dbscan-py
Demo of DBSCAN clustering algorithm
Finds core samples of high density and expands clusters from them.
Out:
Estimated number of clusters: 3

Homogeneity: 0.953

Completeness: 0.883

V-measure: 0.917

Adjusted Rand Index: 0.952

Adjusted Mutual Information: 0.883

Silhouette Coefficient: 0.626
print(__doc__) import numpy as np from sklearn.cluster import DBSCAN
from sklearn import metrics
from sklearn.datasets.samples_generator import make_blobs
from sklearn.preprocessing import StandardScaler # #############################################################################
# Generate sample data
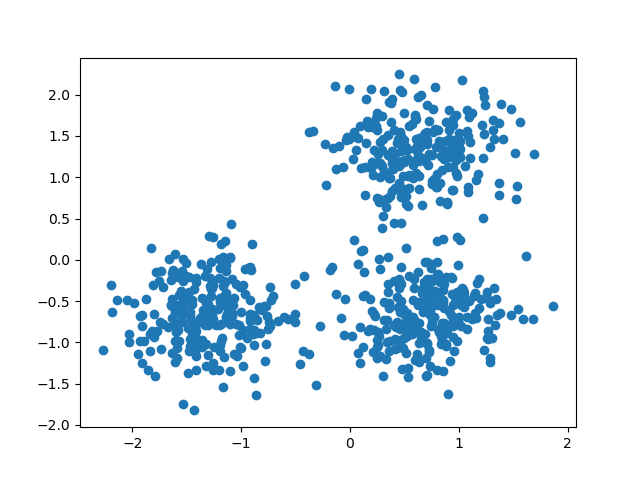
centers = [[1, 1], [-1, -1], [1, -1]]
X, labels_true = make_blobs(n_samples=750, centers=centers, cluster_std=0.4,
random_state=0) X = StandardScaler().fit_transform(X) # #############################################################################
# Compute DBSCAN
db = DBSCAN(eps=0.3, min_samples=10).fit(X)
core_samples_mask = np.zeros_like(db.labels_, dtype=bool)
core_samples_mask[db.core_sample_indices_] = True
labels = db.labels_ # Number of clusters in labels, ignoring noise if present.
n_clusters_ = len(set(labels)) - (1 if -1 in labels else 0) print('Estimated number of clusters: %d' % n_clusters_)
print("Homogeneity: %0.3f" % metrics.homogeneity_score(labels_true, labels))
print("Completeness: %0.3f" % metrics.completeness_score(labels_true, labels))
print("V-measure: %0.3f" % metrics.v_measure_score(labels_true, labels))
print("Adjusted Rand Index: %0.3f"
% metrics.adjusted_rand_score(labels_true, labels))
print("Adjusted Mutual Information: %0.3f"
% metrics.adjusted_mutual_info_score(labels_true, labels))
print("Silhouette Coefficient: %0.3f"
% metrics.silhouette_score(X, labels)) # #############################################################################
# Plot result
import matplotlib.pyplot as plt # Black removed and is used for noise instead.
unique_labels = set(labels)
colors = [plt.cm.Spectral(each)
for each in np.linspace(0, 1, len(unique_labels))]
for k, col in zip(unique_labels, colors):
if k == -1:
# Black used for noise.
col = [0, 0, 0, 1] class_member_mask = (labels == k) xy = X[class_member_mask & core_samples_mask]
plt.plot(xy[:, 0], xy[:, 1], 'o', markerfacecolor=tuple(col),
markeredgecolor='k', markersize=14) xy = X[class_member_mask & ~core_samples_mask]
plt.plot(xy[:, 0], xy[:, 1], 'o', markerfacecolor=tuple(col),
markeredgecolor='k', markersize=6) plt.title('Estimated number of clusters: %d' % n_clusters_)
plt.show()
https://chrisalbon.com/machine_learning/clustering/k-means_clustering/ 这里的iris聚类也用到了
k-Means Clustering

Preliminaries
# Load libraries

from sklearn import datasets

from sklearn.preprocessing import StandardScaler

from sklearn.cluster import KMeans
Load Iris Flower Dataset
# Load data

iris = datasets.load_iris()

X = iris.data
Standardize Features
# Standarize features

scaler = StandardScaler()

X_std = scaler.fit_transform(X)
Conduct k-Means Clustering
# Create k-mean object

clt = KMeans(n_clusters=3, random_state=0, n_jobs=-1)

# Train model

model = clt.fit(X_std)
Show Each Observation’s Cluster Membership
# View predict class

model.labels_
array([1, 1, 1, 1, 1, 1, 1, 1, 1, 1, 1, 1, 1, 1, 1, 1, 1, 1, 1, 1, 1, 1, 1,
1, 1, 1, 1, 1, 1, 1, 1, 1, 1, 1, 1, 1, 1, 1, 1, 1, 1, 1, 1, 1, 1, 1,
1, 1, 1, 1, 0, 0, 0, 2, 2, 2, 0, 2, 2, 2, 2, 2, 2, 2, 2, 0, 2, 2, 2,
2, 0, 2, 2, 2, 2, 0, 0, 0, 2, 2, 2, 2, 2, 2, 2, 0, 0, 2, 2, 2, 2, 2,
2, 2, 2, 2, 2, 2, 2, 2, 0, 2, 0, 0, 0, 0, 2, 0, 0, 0, 0, 0, 0, 2, 2,
0, 0, 0, 0, 2, 0, 2, 0, 2, 0, 0, 2, 0, 0, 0, 0, 0, 0, 2, 2, 0, 0, 0,
2, 0, 0, 0, 2, 0, 0, 0, 2, 0, 0, 2], dtype=int32)
Create New Observation
# Create new observation

new_observation = [[0.8, 0.8, 0.8, 0.8]]
Predict Observation’s Cluster
# Predict observation's cluster

model.predict(new_observation)
array([0], dtype=int32)
View Centers Of Each Cluster
# View cluster centers

model.cluster_centers_
array([[ 1.13597027, 0.09659843, 0.996271 , 1.01717187],
[-1.01457897, 0.84230679, -1.30487835, -1.25512862],
[-0.05021989, -0.88029181, 0.34753171, 0.28206327]])
详细见:详见http://d0evi1.com/sklearn/preprocessing/
标准化
变换后各维特征有0均值,单位方差。也叫z-score规范化(零均值规范化)。计算方式是将特征值减去均值,除以标准差。
from sklearn.preprocessing import scaleX = np.array([[ 1., -1., 2.],[ 2., 0., 0.],[ 0., 1., -1.]])scale(X)
一般会把train和test集放在一起做标准化,或者在train集上做标准化后,用同样的标准化器去标准化test集,此时可以用scaler
from sklearn.preprocessing import StandardScalerscaler = StandardScaler().fit(train)scaler.transform(train)scaler.transform(test)
最小-最大规范化
最小-最大规范化对原始数据进行线性变换,变换到[0,1]区间(也可以是其他固定最小最大值的区间)
min_max_scaler = sklearn.preprocessing.MinMaxScaler()min_max_scaler.fit_transform(X_train)
规范化:正则化
规范化是将不同变化范围的值映射到相同的固定范围,常见的是[0,1],此时也称为归一化。《机器学习》周志华
X = [[ 1, -1, 2],[ 2, 0, 0], [ 0, 1, -1]]sklearn.preprocessing.normalize(X, norm='l2')
array([[ 0.40, -0.40, 0.81], [ 1, 0, 0], [ 0, 0.70, -0.70]])
可以发现对于每一个样本都有,0.4^2+0.4^2+0.81^2=1,这就是L2 norm,变换后每个样本的各维特征的平方和为1。类似地,L1 norm则是变换后每个样本的各维特征的绝对值和为1。还有max norm,则是将每个样本的各维特征除以该样本各维特征的最大值。
在度量样本之间相似性时,如果使用的是二次型kernel,需要做Normalization
特征二值化
给定阈值,将特征转换为0/1
binarizer = sklearn.preprocessing.Binarizer(threshold=1.1)binarizer.transform(X)
标签二值化
from sklearn import preprocessinglb = preprocessing.LabelBinarizer()lb.fit([1, 2, 6, 4, 2])lb.classes_array([1, 2, 4, 6])lb.transform([1, 6])#必须[1, 2, 6, 4, 2]里面array([[1, 0, 0, 0],[0, 0, 0, 1]])
类别特征编码
标签编码
含有异常值
sklearn.preprocessing.robust_scale
生成多项式
原始特征

转化后

poly = sklearn.preprocessing.PolynomialFeatures(2)poly.fit_transform(X)
http://shujuren.org/article/234.html
一、标准化(Z-Score),或者去除均值和方差缩放
公式为:(X-mean)/std 计算时对每个属性/每列分别进行。
将数据按期属性(按列进行)减去其均值,并处以其方差。得到的结果是,对于每个属性/每列来说所有数据都聚集在0附近,方差为1。
实现时,有两种不同的方式:
使用sklearn.preprocessing.scale()函数,可以直接将给定数据进行标准化。
|
1
2
3
4
5
6
7
8
9
10
11
12
13
14
15
16
17
18
|
>>> from sklearn import preprocessing>>> import numpy as np>>> X = np.array([[ 1., -1., 2.],... [ 2., 0., 0.],... [ 0., 1., -1.]])>>> X_scaled = preprocessing.scale(X)>>> X_scaled array([[ 0. ..., -1.22..., 1.33...], [ 1.22..., 0. ..., -0.26...], [-1.22..., 1.22..., -1.06...]])>>>#处理后数据的均值和方差>>> X_scaled.mean(axis=0)array([ 0., 0., 0.])>>> X_scaled.std(axis=0)array([ 1., 1., 1.]) |
使用sklearn.preprocessing.StandardScaler类,使用该类的好处在于可以保存训练集中的参数(均值、方差)直接使用其对象转换测试集数据。
|
1
2
3
4
5
6
7
8
9
10
11
12
13
14
15
16
17
18
19
|
>>> scaler = preprocessing.StandardScaler().fit(X)>>> scalerStandardScaler(copy=True, with_mean=True, with_std=True)>>> scaler.mean_ array([ 1. ..., 0. ..., 0.33...])>>> scaler.std_ array([ 0.81..., 0.81..., 1.24...])>>> scaler.transform(X) array([[ 0. ..., -1.22..., 1.33...], [ 1.22..., 0. ..., -0.26...], [-1.22..., 1.22..., -1.06...]])>>>#可以直接使用训练集对测试集数据进行转换>>> scaler.transform([[-1., 1., 0.]]) array([[-2.44..., 1.22..., -0.26...]]) |
二、将属性缩放到一个指定范围
除了上述介绍的方法之外,另一种常用的方法是将属性缩放到一个指定的最大和最小值(通常是1-0)之间,这可以通过preprocessing.MinMaxScaler类实现。
使用这种方法的目的包括:
1、对于方差非常小的属性可以增强其稳定性。
2、维持稀疏矩阵中为0的条目。
|
1
2
3
4
5
6
7
8
9
10
11
12
13
14
15
16
17
18
19
20
21
22
23
24
|
>>> X_train = np.array([[ 1., -1., 2.],... [ 2., 0., 0.],... [ 0., 1., -1.]])...>>> min_max_scaler = preprocessing.MinMaxScaler()>>> X_train_minmax = min_max_scaler.fit_transform(X_train)>>> X_train_minmaxarray([[ 0.5 , 0. , 1. ], [ 1. , 0.5 , 0.33333333], [ 0. , 1. , 0. ]])>>> #将相同的缩放应用到测试集数据中>>> X_test = np.array([[ -3., -1., 4.]])>>> X_test_minmax = min_max_scaler.transform(X_test)>>> X_test_minmaxarray([[-1.5 , 0. , 1.66666667]])>>> #缩放因子等属性>>> min_max_scaler.scale_ array([ 0.5 , 0.5 , 0.33...])>>> min_max_scaler.min_ array([ 0. , 0.5 , 0.33...]) |
当然,在构造类对象的时候也可以直接指定最大最小值的范围:feature_range=(min, max),此时应用的公式变为:
X_std=(X-X.min(axis=0))/(X.max(axis=0)-X.min(axis=0))
X_scaled=X_std/(max-min)+min
三、正则化(Normalization)
正则化的过程是将每个样本缩放到单位范数(每个样本的范数为1),如果后面要使用如二次型(点积)或者其它核方法计算两个样本之间的相似性这个方法会很有用。
Normalization主要思想是对每个样本计算其p-范数,然后对该样本中每个元素除以该范数,这样处理的结果是使得每个处理后样本的p-范数(l1-norm,l2-norm)等于1。
该方法主要应用于文本分类和聚类中。例如,对于两个TF-IDF向量的l2-norm进行点积,就可以得到这两个向量的余弦相似性。
1、可以使用preprocessing.normalize()函数对指定数据进行转换:
|
1
2
3
4
5
6
7
8
9
|
>>> X = [[ 1., -1., 2.],... [ 2., 0., 0.],... [ 0., 1., -1.]]>>> X_normalized = preprocessing.normalize(X, norm='l2')>>> X_normalized array([[ 0.40..., -0.40..., 0.81...], [ 1. ..., 0. ..., 0. ...], [ 0. ..., 0.70..., -0.70...]]) |
2、可以使用processing.Normalizer()类实现对训练集和测试集的拟合和转换:
|
1
2
3
4
5
6
7
8
9
10
11
12
|
>>> normalizer = preprocessing.Normalizer().fit(X) # fit does nothing>>> normalizerNormalizer(copy=True, norm='l2')>>>>>> normalizer.transform(X) array([[ 0.40..., -0.40..., 0.81...], [ 1. ..., 0. ..., 0. ...], [ 0. ..., 0.70..., -0.70...]])>>> normalizer.transform([[-1., 1., 0.]]) array([[-0.70..., 0.70..., 0. ...]]) |
补充:

sklearn中的数据预处理----good!! 标准化 归一化 在何时使用的更多相关文章
- sklearn中的数据预处理和特征工程
小伙伴们大家好~o( ̄▽ ̄)ブ,沉寂了这么久我又出来啦,这次先不翻译优质的文章了,这次我们回到Python中的机器学习,看一下Sklearn中的数据预处理和特征工程,老规矩还是先强调一下我的开发环境是 ...
- 机器学习实战基础(八):sklearn中的数据预处理和特征工程(一)简介
1 简介 数据挖掘的五大流程: 1. 获取数据 2. 数据预处理 数据预处理是从数据中检测,纠正或删除损坏,不准确或不适用于模型的记录的过程 可能面对的问题有:数据类型不同,比如有的是文字,有的是数字 ...
- 机器学习实战基础(九):sklearn中的数据预处理和特征工程(二) 数据预处理 Preprocessing & Impute 之 数据无量纲化
1 数据无量纲化 在机器学习算法实践中,我们往往有着将不同规格的数据转换到同一规格,或不同分布的数据转换到某个特定分布的需求,这种需求统称为将数据“无量纲化”.譬如梯度和矩阵为核心的算法中,譬如逻辑回 ...
- sklearn中常用数据预处理方法
1. 标准化(Standardization or Mean Removal and Variance Scaling) 变换后各维特征有0均值,单位方差.也叫z-score规范化(零均值规范化).计 ...
- 机器学习实战基础(十):sklearn中的数据预处理和特征工程(三) 数据预处理 Preprocessing & Impute 之 缺失值
缺失值 机器学习和数据挖掘中所使用的数据,永远不可能是完美的.很多特征,对于分析和建模来说意义非凡,但对于实际收集数据的人却不是如此,因此数据挖掘之中,常常会有重要的字段缺失值很多,但又不能舍弃字段的 ...
- matlab、sklearn 中的数据预处理
数据预处理(normalize.scale) 0. 使用 PCA 降维 matlab: [coeff, score] = pca(A); reducedDimension = coeff(:,1:5) ...
- 机器学习实战基础(十五):sklearn中的数据预处理和特征工程(八)特征选择 之 Filter过滤法(二) 相关性过滤
相关性过滤 方差挑选完毕之后,我们就要考虑下一个问题:相关性了. 我们希望选出与标签相关且有意义的特征,因为这样的特征能够为我们提供大量信息.如果特征与标签无关,那只会白白浪费我们的计算内存,可能还会 ...
- 机器学习实战基础(十三):sklearn中的数据预处理和特征工程(六)特征选择 feature_selection 简介
当数据预处理完成后,我们就要开始进行特征工程了. 在做特征选择之前,有三件非常重要的事:跟数据提供者开会!跟数据提供者开会!跟数据提供者开会!一定要抓住给你提供数据的人,尤其是理解业务和数据含义的人, ...
- 机器学习实战基础(十一):sklearn中的数据预处理和特征工程(四) 数据预处理 Preprocessing & Impute 之 处理分类特征:编码与哑变量
处理分类特征:编码与哑变量 在机器学习中,大多数算法,譬如逻辑回归,支持向量机SVM,k近邻算法等都只能够处理数值型数据,不能处理文字,在sklearn当中,除了专用来处理文字的算法,其他算法在fit的 ...
随机推荐
- Irrlicht 1.8.4 + Win7 + VC2015 + x64 +OpenGL编译
1. 下载irrlicht1.8.4 https://nchc.dl.sourceforge.net/project/irrlicht/Irrlicht%20SDK/1.8/1.8.4/irrlich ...
- POJ 1200 Hash
我的hash从来没写对过........ (白学了快一年OI --原来连个hash都没写对过) 但是 但是 今天是一个值得纪念的日子. 看看标题 我竟然在写hash的题解. (好了好了 废话少说) 题 ...
- iterator和iterable的区别
相关博客: http://blog.csdn.net/lipengcn/article/details/51700153 Java中Iterable和Iterator的辨析 http ...
- OpenCV+VS 2015开发环境配置
最近跑C程序,头文件中用到了OpenCV中的文件,找了很多篇OpenCV+VS的环境配置,发现如下这篇写的最为详细,特转载来自己的博客中留存,并附上原博客地址如下 OpenCV学习笔记(一)——Ope ...
- BZOJ4517: [Sdoi2016]排列计数(组合数+错位排列)
Time Limit: 60 Sec Memory Limit: 128 MBSubmit: 1626 Solved: 994[Submit][Status][Discuss] Descripti ...
- 用opcity模拟zindex渐变的效果
github地址: https://github.com/echoorx/opacity-Gradient zindex好像不能渐变改变,所以用opcity来模拟 <!DOCTYPE html& ...
- Javascript Proxy对象 简介
Javascript Proxy对象 简介 Javascript Proxy对象 改变你操作对象的方式 Proxies 是Javasript对象的中间件 ...或者说至少是那种很早的版本. ES6 中 ...
- 解决Android单个dex文件不能超过65535个方法问题
一.找坑:谷歌规定单个dex文件中的方法不能超过65536的限制 我们编写项目过程中在工程的lib文件夹下引用的第三方插件jar包太多或者项目过大,编译运行时就有可能报出com.android.dex ...
- axis2服务器搭建
一. axis2服务器搭建 简单起见, axis2r搭建采用较为简单的一种方式, 即将服务类和services.xml打成.aar包发布. 1. 下载部署axis2 http://axis.apach ...
- linux网络路由配置
网卡配置文件介绍: # vi /etc/sysconfig/network-scripts/ifcfg-eth0 DEVICE=eth0 (描述网卡对应的设备别名,例如ifcfg-eth0的文件中它为 ...