微服务SpringCloud之熔断监控Hystrix Dashboard和Turbine
Hystrix-dashboard是一款针对Hystrix进行实时监控的工具,通过Hystrix Dashboard我们可以在直观地看到各Hystrix Command的请求响应时间, 请求成功率等数据。但是只使用Hystrix Dashboard的话, 你只能看到单个应用内的服务信息, 这明显不够. 我们需要一个工具能让我们汇总系统内多个服务的数据并显示到Hystrix Dashboard上, 这个工具就是Turbine.用数据、图表展示更加直观,让数据说话,一图顶千言。
一、Hystrix Dashboard
1.引入依赖
在EurekaConsumer项目中引入Hystrix Dashboard也比较容易,只需在pom.xml中引入依赖,主要引入spring-cloud-starter-netflix-hystrix、spring-cloud-starter-netflix-hystrix-dashboard、spring-boot-starter-actuator。
<?xml version="1.0" encoding="UTF-8"?>

<project xmlns="http://maven.apache.org/POM/4.0.0" xmlns:xsi="http://www.w3.org/2001/XMLSchema-instance"

    xsi:schemaLocation="http://maven.apache.org/POM/4.0.0 http://maven.apache.org/xsd/maven-4.0.0.xsd">

    <modelVersion>4.0.0</modelVersion>

    <parent>

        <groupId>org.springframework.boot</groupId>

        <artifactId>spring-boot-starter-parent</artifactId>

        <version>2.1.6.RELEASE</version>

        <relativePath/> <!-- lookup parent from repository -->

    </parent>

    <groupId>com.example</groupId>

    <artifactId>EurekaConsumer</artifactId>

    <version>0.0.1-SNAPSHOT</version>

    <name>EurekaConsumer</name>

    <description>Demo project for Spring Boot</description>

    <properties>

        <java.version>1.8</java.version>

        <spring-cloud.version>Greenwich.SR1</spring-cloud.version>

    </properties>

    <dependencies>

        <dependency>

            <groupId>org.springframework.boot</groupId>

            <artifactId>spring-boot-starter-web</artifactId>

        </dependency>

        <dependency>

            <groupId>org.springframework.cloud</groupId>

            <artifactId>spring-cloud-starter-netflix-eureka-client</artifactId>

        </dependency>

        <dependency>

            <groupId>org.springframework.cloud</groupId>

            <artifactId>spring-cloud-starter-openfeign</artifactId>

        </dependency>

        <!-- https://mvnrepository.com/artifact/org.springframework.cloud/spring-cloud-openfeign-core -->

        <dependency>

            <groupId>org.springframework.cloud</groupId>

            <artifactId>spring-cloud-openfeign-core</artifactId>

            <version>2.1.2.RELEASE</version>

        </dependency>

        <!-- https://mvnrepository.com/artifact/org.springframework.cloud/spring-cloud-starter-netflix-hystrix -->

        <dependency>

            <groupId>org.springframework.cloud</groupId>

            <artifactId>spring-cloud-starter-netflix-hystrix</artifactId>

            <version>2.1.2.RELEASE</version>

        </dependency>

        <!-- https://mvnrepository.com/artifact/org.springframework.cloud/spring-cloud-starter-netflix-hystrix-dashboard -->

        <dependency>

            <groupId>org.springframework.cloud</groupId>

            <artifactId>spring-cloud-starter-netflix-hystrix-dashboard</artifactId>

            <version>2.1.2.RELEASE</version>

        </dependency>

        <!-- https://mvnrepository.com/artifact/org.springframework.boot/spring-boot-starter-actuator -->

        <dependency>

            <groupId>org.springframework.boot</groupId>

            <artifactId>spring-boot-starter-actuator</artifactId>

            <version>2.1.6.RELEASE</version>

        </dependency>

        <dependency>

            <groupId>org.springframework.boot</groupId>

            <artifactId>spring-boot-starter-test</artifactId>

            <scope>test</scope>

        </dependency>

    </dependencies>

    <dependencyManagement>

        <dependencies>

            <dependency>

                <groupId>org.springframework.cloud</groupId>

                <artifactId>spring-cloud-dependencies</artifactId>

                <version>${spring-cloud.version}</version>

                <type>pom</type>

                <scope>import</scope>

            </dependency>

        </dependencies>

    </dependencyManagement>

    <build>

        <plugins>

            <plugin>

                <groupId>org.springframework.boot</groupId>

                <artifactId>spring-boot-maven-plugin</artifactId>

            </plugin>

        </plugins>

    </build>

    <packaging>war</packaging>

</project>
2.启用@EnableHystrixDashboard、@EnableCircuitBreaker
在main方法类中增加注解@EnableHystrixDashboard、@EnableCircuitBreaker,如果只是添加注解还是不够的,运行的时候会报404的错误,还需要在EurekaConsumerApplication类中增加ServletRegistrationBean,设置映射的url。
package com.example.demo;

import org.springframework.boot.SpringApplication;

import org.springframework.boot.autoconfigure.SpringBootApplication;

import org.springframework.boot.web.servlet.ServletRegistrationBean;

import org.springframework.cloud.client.circuitbreaker.EnableCircuitBreaker;

import org.springframework.cloud.client.discovery.EnableDiscoveryClient;

import org.springframework.cloud.netflix.hystrix.dashboard.EnableHystrixDashboard;

import org.springframework.cloud.openfeign.EnableFeignClients;

import org.springframework.context.annotation.Bean;

import com.netflix.hystrix.contrib.metrics.eventstream.HystrixMetricsStreamServlet;

@SpringBootApplication

@EnableDiscoveryClient

@EnableFeignClients

@EnableHystrixDashboard

@EnableCircuitBreaker

public class EurekaConsumerApplication {

    public static void main(String[] args) {

        SpringApplication.run(EurekaConsumerApplication.class, args);

    }

      @Bean

      public ServletRegistrationBean getServlet() {

        HystrixMetricsStreamServlet streamServlet = new HystrixMetricsStreamServlet();

        ServletRegistrationBean registrationBean = new ServletRegistrationBean(streamServlet);

        registrationBean.setLoadOnStartup(1);

        registrationBean.addUrlMappings("/hystrix.stream");

        registrationBean.setName("HystrixMetricsStreamServlet");

        return registrationBean;

      }

}
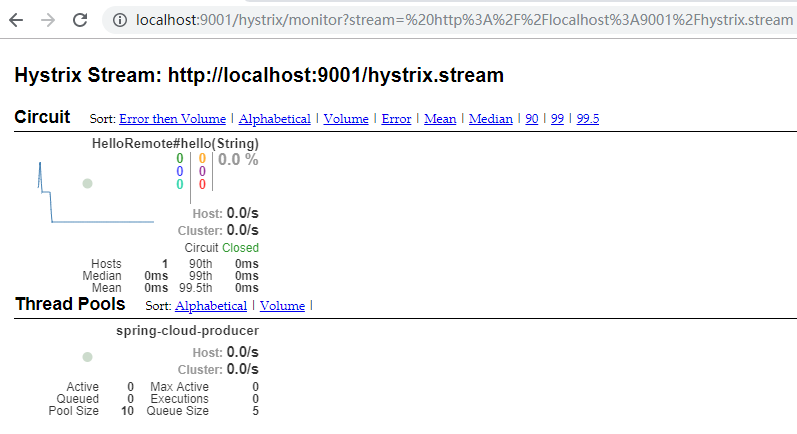
3.输入http://localhost:9001/hystrix时,会显示如下页面
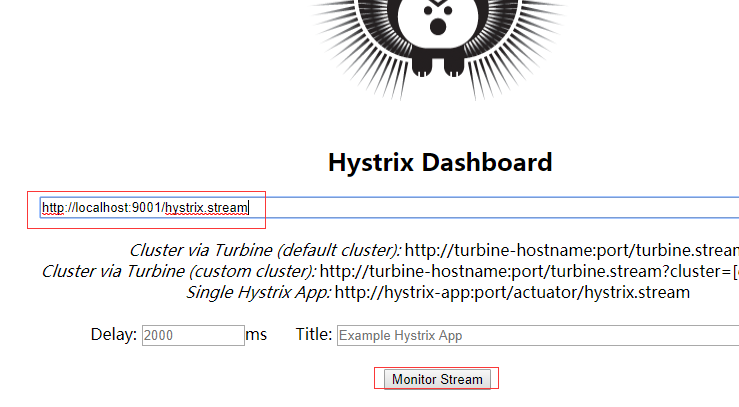
在上面的页面输入http://localhost:9001/hystrix.stream,点击Monitor Stream,然后请求http://localhost:9001/hello?name=cuiyw,就会在点击页面弹出的新页面中看到监控。
二、Turbine
在复杂的分布式系统中,相同服务的节点经常需要部署上百甚至上千个,很多时候,运维人员希望能够把相同服务的节点状态以一个整体集群的形式展现出来,这样可以更好的把握整个系统的状态。 为此,Netflix提供了一个开源项目(Turbine)来提供把多个hystrix.stream的内容聚合为一个数据源供Dashboard展示。
1.引入依赖
这里新建了HystrixTurbine项目,在项目中主要引入spring-cloud-starter-netflix-hystrix-dashboard、spring-cloud-starter-netflix-turbine、spring-boot-starter-actuator、spring-cloud-starter-netflix-turbine-stream。
<?xml version="1.0" encoding="UTF-8"?>

<project xmlns="http://maven.apache.org/POM/4.0.0" xmlns:xsi="http://www.w3.org/2001/XMLSchema-instance"

    xsi:schemaLocation="http://maven.apache.org/POM/4.0.0 http://maven.apache.org/xsd/maven-4.0.0.xsd">

    <modelVersion>4.0.0</modelVersion>

    <parent>

        <groupId>org.springframework.boot</groupId>

        <artifactId>spring-boot-starter-parent</artifactId>

        <version>2.1.6.RELEASE</version>

        <relativePath/> <!-- lookup parent from repository -->

    </parent>

    <groupId>com.example</groupId>

    <artifactId>HystrixTurbine</artifactId>

    <version>0.0.1-SNAPSHOT</version>

    <name>HystrixTurbine</name>

    <description>Demo project for Spring Boot</description>

    <properties>

        <java.version>1.8</java.version>

        <spring-cloud.version>Greenwich.SR2</spring-cloud.version>

    </properties>

    <dependencies>

        <dependency>

            <groupId>org.springframework.cloud</groupId>

            <artifactId>spring-cloud-starter-netflix-hystrix-dashboard</artifactId>

        </dependency>

        <dependency>

            <groupId>org.springframework.cloud</groupId>

            <artifactId>spring-cloud-starter-netflix-turbine</artifactId>

        </dependency>

        <dependency>

            <groupId>org.springframework.boot</groupId>

            <artifactId>spring-boot-starter-test</artifactId>

            <scope>test</scope>

        </dependency>

        <!-- https://mvnrepository.com/artifact/org.springframework.boot/spring-boot-starter-actuator -->

         <dependency>

            <groupId>org.springframework.boot</groupId>

            <artifactId>spring-boot-starter-actuator</artifactId>

            <version>2.1.6.RELEASE</version>

        </dependency>

                <!-- https://mvnrepository.com/artifact/org.springframework.cloud/spring-cloud-starter-netflix-turbine-stream -->

         <dependency>

            <groupId>org.springframework.cloud</groupId>

            <artifactId>spring-cloud-starter-netflix-turbine-stream</artifactId>

            <version>2.0.1.RELEASE</version>

        </dependency>

    </dependencies>

    <dependencyManagement>

        <dependencies>

            <dependency>

                <groupId>org.springframework.cloud</groupId>

                <artifactId>spring-cloud-dependencies</artifactId>

                <version>${spring-cloud.version}</version>

                <type>pom</type>

                <scope>import</scope>

            </dependency>

        </dependencies>

    </dependencyManagement>

    <build>

        <plugins>

            <plugin>

                <groupId>org.springframework.boot</groupId>

                <artifactId>spring-boot-maven-plugin</artifactId>

            </plugin>

        </plugins>

    </build>

    <packaging>war</packaging>

</project>
2.设置配置文件
spring.application.name=hystrix-dashboard-turbine

server.port=8002

turbine.appConfig=spring-cloud-consumerA,spring-cloud-consumerB

turbine.aggregator.clusterConfig= default

turbine.clusterNameExpression= new String("default")

eureka.client.serviceUrl.defaultZone=http://localhost:8088/eureka/

spring.main.allow-bean-definition-overriding=true

turbine.instanceUrlSuffix.default =hystrix.stream
turbine.appConfig :配置Eureka中的serviceId列表,表明监控哪些服务
turbine.aggregator.clusterConfig :指定聚合哪些集群,多个使用”,”分割,默认为default。可使用http://.../turbine.stream?cluster={clusterConfig之一}访问
turbine.clusterNameExpression : 1. clusterNameExpression指定集群名称,默认表达式appName;此时:turbine.aggregator.clusterConfig需要配置想要监控的应用名称;2. 当clusterNameExpression: default时,turbine.aggregator.clusterConfig可以不写,因为默认就是default;3. 当clusterNameExpression: metadata[‘cluster’]时,假设想要监控的应用配置了eureka.instance.metadata-map.cluster: ABC,则需要配置,同时turbine.aggregator.clusterConfig: ABC
3.设置@EnableHystrixDashboard、@EnableTurbineStream、@EnableTurbine
package com.example.demo;

import org.springframework.boot.SpringApplication;

import org.springframework.boot.autoconfigure.SpringBootApplication;

import org.springframework.cloud.netflix.hystrix.dashboard.EnableHystrixDashboard;

import org.springframework.cloud.netflix.turbine.EnableTurbine;

import org.springframework.cloud.netflix.turbine.stream.EnableTurbineStream;

@SpringBootApplication

@EnableHystrixDashboard

@EnableTurbineStream

@EnableTurbine

public class HystrixTurbineApplication {

    public static void main(String[] args) {

        SpringApplication.run(HystrixTurbineApplication.class, args);

    }

}
4.测试
分别启动EurekaServer、EurekaClient,分别修改EurekaConsumer,设置端口9001、9002,以及对应的spring.application.name为spring-cloud-consumerA、spring-cloud-consumerB,并启动,最后启动HystrixTurbine。
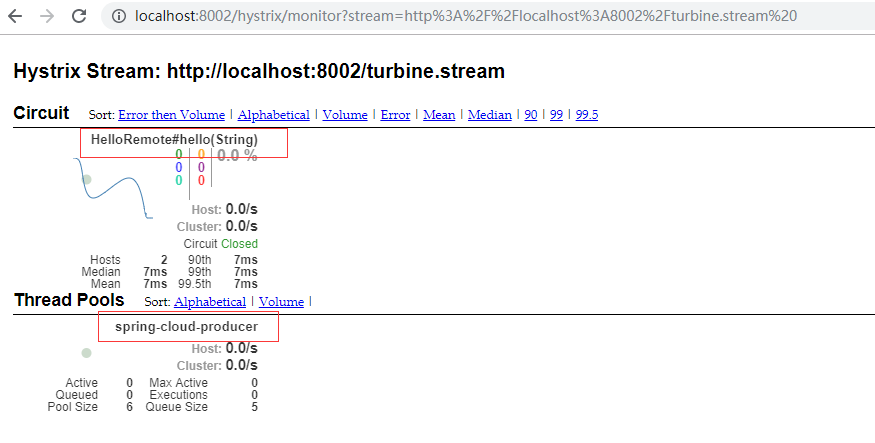
在浏览器中输入http://localhost:8002/hystrix,在出现的页面中输入http://localhost:8002/turbine.stream ,点击Monitor Stream,在浏览器中分别输入http://localhost:9002/hello?name=cuiyw、http://localhost:9001/hello?name=cuiyw,之后可以观察监控页面。由于这里只有一个接口一个生产者,所以只显示了一个。
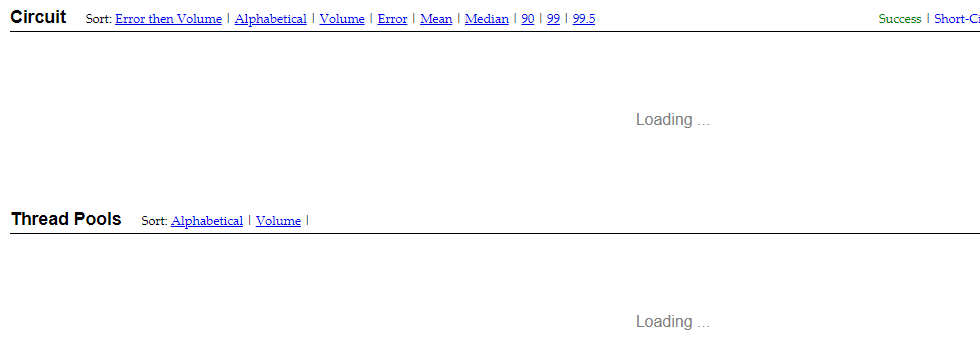
这里还有一个要注意的,由于未在配置文件中设置turbine.instanceUrlSuffix.default =hystrix.stream,导致打开监控页面时一直在loading。日志报com.netflix.turbine.monitor.instance.InstanceMonitor$MisconfiguredHostException: [{"timestamp":"2019-07-21T14:05:10.222+0000","status":404,"error":"Not Found","message":"No message available","path":"/actuator/hystrix.stream"}]错误。
微服务SpringCloud之熔断监控Hystrix Dashboard和Turbine的更多相关文章
- 跟我学SpringCloud | 第五篇:熔断监控Hystrix Dashboard和Turbine
SpringCloud系列教程 | 第五篇:熔断监控Hystrix Dashboard和Turbine Springboot: 2.1.6.RELEASE SpringCloud: Greenwich ...
- springcloud(五):熔断监控Hystrix Dashboard和Turbine
Hystrix-dashboard是一款针对Hystrix进行实时监控的工具,通过Hystrix Dashboard我们可以在直观地看到各Hystrix Command的请求响应时间, 请求成功率等数 ...
- spring cloud(五)熔断监控Hystrix Dashboard和Turbine
Hystrix-dashboard是一款针对Hystrix进行实时监控的工具,通过Hystrix Dashboard我们可以在直观地看到各Hystrix Command的请求响应时间, 请求成功率等数 ...
- Spring Cloud(五):熔断监控Hystrix Dashboard和Turbine
Hystrix-dashboard是一款针对Hystrix进行实时监控的工具,通过Hystrix Dashboard我们可以在直观地看到各Hystrix Command的请求响应时间, 请求成功率等数 ...
- spring cloud深入学习(六)-----熔断监控Hystrix Dashboard和Turbine
Hystrix-dashboard是一款针对Hystrix进行实时监控的工具,通过Hystrix Dashboard我们可以在直观地看到各Hystrix Command的请求响应时间, 请求成功率等数 ...
- spring cloud熔断监控Hystrix Dashboard和Turbine
参考: http://blog.csdn.net/ityouknow/article/details/72625646 完整pom <?xml version="1.0" e ...
- spring-cloud:熔断监控Hystrix Dashboard和Turbine的示例
1.运行环境 开发工具:intellij idea JDK版本:1.8 项目管理工具:Maven 4.0.0 2.GITHUB地址 https://github.com/nbfujx/springCl ...
- Spring Cloud 入门教程(八): 断路器指标数据监控Hystrix Dashboard 和 Turbine
1. Hystrix Dashboard (断路器:hystrix 仪表盘) Hystrix一个很重要的功能是,可以通过HystrixCommand收集相关数据指标. Hystrix Dashboa ...
- springcloud(十):熔断监控Hystrix Dashboard
申明: 这里比较坑爹,大家写的时候要小心,这里和springboot的版本有关系哈,我使用的是2.0 版本,要么调频为1.5 版本,要么使用其他方式 解决错误,我选择了还是用2.0 ...
随机推荐
- 使用百度网盘+Git,把版本控制托管到云端,附精彩评论
http://www.cnblogs.com/vajoy/p/3929675.html 我试过多个这种双向同步的网盘,在网络状况不好.系统卡顿以及某些程序BUG的情况下,同步会有错乱现象,尤其是多个电 ...
- Hadoop集群(第2期)虚拟机网卡的介绍和配置
很多人安装虚拟机的时候,经常遇到不能上网的问题,而vmware有三种网络模式,对初学者来说也比较眼花聊乱,今天我就来基于虚拟机3种网络模式,帮大家普及下虚拟机上网的背景知识 虚拟机网络模式 无论是vm ...
- javaweb各种框架组合案例(一):maven+spring+springMVC+jdbcTemplate
为了体现spring jdbc对于单表操作的优势,我专门对dao层做了一个抽离,使得抽离出的核心dao具有通用性.主要技术难点是对于泛型的反射.注意:单表操作中,数据库表的字段要和实体类的属性名保持高 ...
- nvm淘宝源升级安装最新稳定版nodejs
为了在服务器上面升级nodejs,用nvm下载实在太慢了,推荐淘宝源安装命令,非常快能安装好: 第一步: NVM_NODEJS_ORG_MIRROR=https://npm.taobao.org/mi ...
- 关于Git GUI的使用方式
1.选择Clone Existing Repository 2.选择clone地址和存放位置,然后clone 3失败 4如果失败,让对方去这里(github的界面)邀请下,如果是自己就不用 5然后等待 ...
- 你一定能看懂的JDK动态代理
前言:阅读这篇文章前,一定要知道什么是代理模式,具体可以参考这篇文章<设计模式(一):代理模式>. 在<设计模式(一):代理模式>一文中说了,程序员思思买书有两种选择:一种是选 ...
- 系列教程 - java web开发
代码之间工作室持续推出Java Web开发系列教程与案例,供广大朋友分享交流技术经验,帮助喜欢java的朋友们学习进步: java web 开发教程(1) - 开发环境搭建 技术交流QQ群: 商务合作 ...
- 音乐盒子mplayer问题review
背景:实现全志R16-linux开发板上的mplayer的调试 一.mplayer软件架构: 这里详细介绍了alsa的相关知识 二.问题解决1:播放卡顿 0.问题描述:播放过程中会突然发生卡顿,就 ...
- Swift的访问控制讲解
Swift中访问修饰符总共有5种,分别为fileprivate,private,internal,public和open,其中,fileprivate以及open是Swift 3新添加的.因为过去的S ...
- vmware vSphere Data Protection 6.1 使用备份、恢复、报告
一.6个选项卡说明 1.getting started 开始,提供VDP功能概述以及指向创建备份作业向导.恢复向导.报告选项卡的快速连接 2.backup 提供已计划备份作业的列表以及有关备份作业的详 ...