《DSP using MATLAB》 示例 Example 9.12

代码:
%% ------------------------------------------------------------------------

%%            Output Info about this m-file

fprintf('\n***********************************************************\n');

fprintf('        <DSP using MATLAB> Exameple 9.12 \n\n');

time_stamp = datestr(now, 31);

[wkd1, wkd2] = weekday(today, 'long');

fprintf('      Now is %20s, and it is %7s  \n\n', time_stamp, wkd2);

%% ------------------------------------------------------------------------

% Given Parameters:

D = 2; Rp = 0.1; As = 30; wp = pi/D; ws = wp+0.1*pi;

% Filter Design:

[delta1, delta2] = db2delta(Rp, As);

[N, F, A, weights] = firpmord([wp, ws]/pi, [1, 0], [delta1, delta2], 2);

h = firpm(N, F, A, weights);

delay = N/2;                        % delay imparted by the filter

%% -----------------------------------------------------------------

%%                             Plot

%% -----------------------------------------------------------------

% Input signal x1(n) = cos(2*pi*n/16)

n = [0:256]; x = cos(pi*n/8);

n1 = n(1:33); x1 = x(33:65);            % for plotting purposes

Hf1 = figure('units', 'inches', 'position', [1, 1, 8, 6], ...

	'paperunits', 'inches', 'paperposition', [0, 0, 6, 4], ...

	'NumberTitle', 'off', 'Name', 'Exameple 9.12');

set(gcf,'Color','white');

TF = 10;

subplot(2, 2, 1);

Hs1 = stem(n1, x1, 'filled'); set(Hs1, 'markersize', 2, 'color', 'g');

axis([-2, 34, -1.2, 1.2]); grid on;

xlabel('n', 'vertical', 'middle'); ylabel('Amplitude');

title('Input Singal: x1(n) = cos(\pin/8) ', 'fontsize', TF, 'vertical', 'baseline');

set(gca, 'xtick', [0:8:32]);

set(gca, 'ytick', [-1, 0, 1]);

% Decimation of x1(n): D = 2

y = upfirdn(x, h, 1, D);

m = delay+1:1:128/D+delay+1; y = y(m); m = 0:16; y = y(16:32);

subplot(2, 2, 3);

Hs2 = stem(m, y, 'filled'); set(Hs2, 'markersize', 2, 'color', 'm');

axis([-1, 17, -1.2, 1.2]); grid on;

xlabel('m', 'vertical', 'middle'); ylabel('Amplitude', 'vertical', 'cap');

title('Output Singal: y1(n): D=2', 'fontsize', TF, 'vertical', 'baseline');

set(gca, 'xtick', [0:8:32]/D);

set(gca, 'ytick', [-1, 0, 1]);

% Input signal x2(n) = cos(8*pi*n/16)

n = [0:256]; x = cos(8*pi*n/(16));

n2 = n(1:33); x2 = x(33:65);            % for plotting purposes

subplot(2, 2, 2);

Hs3 = stem(n2, x2, 'filled'); set(Hs3, 'markersize', 2, 'color', 'g');

axis([-2, 34, -1.2, 1.2]); grid on;

xlabel('n', 'vertical', 'middle'); ylabel('Amplitude', 'vertical', 'cap');

title('Input Singal: x2(n)=cos(\pin/2) ', 'fontsize', TF, 'vertical', 'baseline');

set(gca, 'xtick', [0:8:32]);

set(gca, 'ytick', [-1, 0, 1]);

% Decimation of x2(n): D = 2

y = upfirdn(x, [h], 1, D);           % y = downsample(conv(x,h),2);

m = delay+1:1:128/D+delay+1; y = y(m); m = 0:16; y = y(16:32);

subplot(2, 2, 4);

Hs4 = stem(m, y, 'filled'); set(Hs4, 'markersize', 2, 'color', 'm');

axis([-1, 17, -1.2, 1.2]); grid on;

xlabel('m', 'vertical', 'middle'); ylabel('Amplitude', 'vertical', 'cap');

title('Output Singal: y2(n): D=2', 'fontsize', TF, 'vertical', 'baseline');

set(gca, 'xtick', [0:8:32]/D);

set(gca, 'ytick', [-1, 0, 1]);
运行结果:
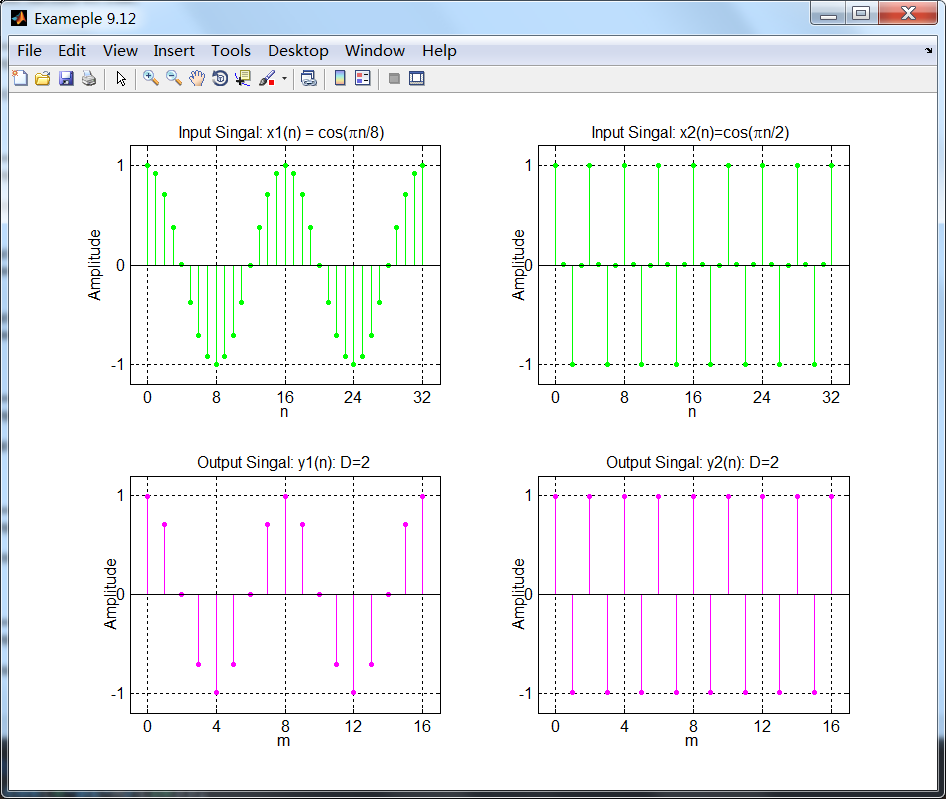
左半边的图展示了x1(n)和相应减采样结果信号y1(n),右半边展示了x2(n)和相应减采样y2(n)。两种情况下减采样
看上去都正确。如果我们选π/2以上的任何频率,那么滤波器将会衰减或消除信号。
《DSP using MATLAB》 示例 Example 9.12的更多相关文章
- 《DSP using MATLAB》Problem 7.12
阻带衰减50dB,我们选Hamming窗 代码: %% ++++++++++++++++++++++++++++++++++++++++++++++++++++++++++++++++++++++++ ...
- 《DSP using MATLAB》Problem 6.12
代码: %% ++++++++++++++++++++++++++++++++++++++++++++++++++++++++++++++++++++++++++++++++ %% Output In ...
- 《DSP using MATLAB》Problem 5.12
1.从别的地方找的证明过程: 2.代码 function x2 = circfold(x1, N) %% Circular folding using DFT %% ----------------- ...
- 《DSP using MATLAB》Problem 8.12
代码: %% ------------------------------------------------------------------------ %% Output Info about ...
- DSP using MATLAB 示例 Example3.12
用到的性质 代码: n = -5:10; x = sin(pi*n/2); k = -100:100; w = (pi/100)*k; % freqency between -pi and +pi , ...
- DSP using MATLAB 示例Example2.12
代码: b = [1]; a = [1, -0.9]; n = [-5:50]; h = impz(b,a,n); set(gcf,'Color','white'); %subplot(2,1,1); ...
- DSP using MATLAB 示例Example3.21
代码: % Discrete-time Signal x1(n) % Ts = 0.0002; n = -25:1:25; nTs = n*Ts; Fs = 1/Ts; x = exp(-1000*a ...
- DSP using MATLAB 示例 Example3.19
代码: % Analog Signal Dt = 0.00005; t = -0.005:Dt:0.005; xa = exp(-1000*abs(t)); % Discrete-time Signa ...
- DSP using MATLAB示例Example3.18
代码: % Analog Signal Dt = 0.00005; t = -0.005:Dt:0.005; xa = exp(-1000*abs(t)); % Continuous-time Fou ...
- DSP using MATLAB 示例 Example3.11
用到的性质 上代码: n = -5:10; x = rand(1,length(n)); k = -100:100; w = (pi/100)*k; % freqency between -pi an ...
随机推荐
- node必知必会之node简介
1.什么是node.js 按照: Node.js官方网站主页 的说法: Node.js® is a JavaScript runtime built on Chrome's V8 JavaScript ...
- ng-深度学习-课程笔记-11: 卷积神经网络(Week1)
1 边缘检测( edage detection ) 下图是垂直边缘检测的例子,实际上就是用一个卷积核进行卷积的过程. 这个例子告诉我们,卷积可以完成垂直方向的边缘检测.同理卷积也可以完成水平方向的边缘 ...
- Digital Image Processing 学习笔记1
第一章 1.1 数字图像 一幅图像可以定义为一个而为函数, 其中x和y是空间坐标,而在任何一对空间坐标(x, y)处的幅值f称为图像在该点处的强度或灰度.当x, y和灰度值f是有限的离散数值时,该图像 ...
- Dijkstra算法补分
要求 Dijkstra算法,求解附图顶点A的单源最短路径 在纸上画出求解过程,上传截图(注意图上要有自己的学号和姓名) 过程
- HDU6447 网络赛 YJJ's Salesman(DP + 线段树)题解
思路:若用dp[i][j]表示走到(i,j)的最大值,那么dp[i][j] = max(dp[i - 1][j],dp[i][j - 1],dp[i - 1][j - 1] + v),显然O(n^2) ...
- [kata](5kyu) 约瑟夫战死排序(排列)
之前一直不懂,今天百度了下,发下kyu是级别的意思,dan是段的意思,级别数值越小越强,段数数值越大越强. 原题 https://www.codewars.com/kata/josephus-per ...
- python 三维数组找最小值
#声明三维数组 num=[[[,,],[,,],[,,]], \ [[,,],[,,],[,,]]] value=num[][][]#设置main为num数组的第一个元素 ): ): ): if(va ...
- vue2.0 组件和v-model
本文适合初学组件编写的同学阅读. 乍一看这个标题,可能会有疑问:v-model和组件也能扯到一起? 我打算写这篇文章的时候,也是这么想的.咱们按简历的那一套STAR法则来梳理一下这篇文章: 情景[Si ...
- Java IO流-序列化流和反序列化流
2017-11-05 20:42:06 序列化流:把对象按照流的方式存入文本文件或者在网络中传输. 对象 -- 流数据(ObjectOutputStream) 反序列化流:把文本文件中的流对象数据或者 ...
- 不能用Xming连接到 Centos 7
修改/etc/gdm/custom.conf 之后, Centos 6是没有问题的. 可是Centos 7 不行. 根据这个连接,运行firewall-config,把网络改到trusted级别, 能 ...