吴裕雄--天生自然 R语言开发学习:高级数据管理(续三)


#-----------------------------------#
# R in Action (2nd ed): Chapter 5 #
# Advanced data management #
# requires that the reshape2 #
# package has been installed #
# install.packages("reshape2") #
#-----------------------------------# # Class Roster Dataset
Student <- c("John Davis","Angela Williams","Bullwinkle Moose",
"David Jones","Janice Markhammer",
"Cheryl Cushing","Reuven Ytzrhak",
"Greg Knox","Joel England","Mary Rayburn")
math <- c(502, 600, 412, 358, 495, 512, 410, 625, 573, 522)
science <- c(95, 99, 80, 82, 75, 85, 80, 95, 89, 86)
english <- c(25, 22, 18, 15, 20, 28, 15, 30, 27, 18)
roster <- data.frame(Student, math, science, english,
stringsAsFactors=FALSE) # Listing 5.1 - Calculating the mean and standard deviation
x <- c(1, 2, 3, 4, 5, 6, 7, 8)
mean(x)
sd(x)
n <- length(x)
meanx <- sum(x)/n
css <- sum((x - meanx)**2)
sdx <- sqrt(css / (n-1))
meanx
sdx # Listing 5.2 - Generating pseudo-random numbers from
# a uniform distribution
runif(5)
runif(5)
set.seed(1234)
runif(5)
set.seed(1234)
runif(5) # Listing 5.3 - Generating data from a multivariate
# normal distribution
library(MASS)
mean <- c(230.7, 146.7, 3.6)
sigma <- matrix( c(15360.8, 6721.2, -47.1,
6721.2, 4700.9, -16.5,
-47.1, -16.5, 0.3), nrow=3, ncol=3)
set.seed(1234)
mydata <- mvrnorm(500, mean, sigma)
mydata <- as.data.frame(mydata)
names(mydata) <- c("y", "x1", "x2")
dim(mydata)
head(mydata, n=10) # Listing 5.4 - Applying functions to data objects
a <- 5
sqrt(a)
b <- c(1.243, 5.654, 2.99)
round(b)
c <- matrix(runif(12), nrow=3)
c
log(c)
mean(c) # Listing 5.5 - Applying a function to the rows (columns) of a matrix
mydata <- matrix(rnorm(30), nrow=6)
mydata
apply(mydata, 1, mean)
apply(mydata, 2, mean)
apply(mydata, 2, mean, trim=.4) # Listing 5.6 - A solution to the learning example
options(digits=2)
Student <- c("John Davis", "Angela Williams", "Bullwinkle Moose",
"David Jones", "Janice Markhammer", "Cheryl Cushing",
"Reuven Ytzrhak", "Greg Knox", "Joel England",
"Mary Rayburn")
Math <- c(502, 600, 412, 358, 495, 512, 410, 625, 573, 522)
Science <- c(95, 99, 80, 82, 75, 85, 80, 95, 89, 86)
English <- c(25, 22, 18, 15, 20, 28, 15, 30, 27, 18) roster <- data.frame(Student, Math, Science, English,
stringsAsFactors=FALSE) z <- scale(roster[,2:4])
score <- apply(z, 1, mean)
roster <- cbind(roster, score) y <- quantile(score, c(.8,.6,.4,.2))
roster$grade[score >= y[1]] <- "A"
roster$grade[score < y[1] & score >= y[2]] <- "B"
roster$grade[score < y[2] & score >= y[3]] <- "C"
roster$grade[score < y[3] & score >= y[4]] <- "D"
roster$grade[score < y[4]] <- "F" name <- strsplit((roster$Student), " ")
Lastname <- sapply(name, "[", 2)
Firstname <- sapply(name, "[", 1)
roster <- cbind(Firstname,Lastname, roster[,-1])
roster <- roster[order(Lastname,Firstname),] roster # Listing 5.4 - A switch example
feelings <- c("sad", "afraid")
for (i in feelings)
print(
switch(i,
happy = "I am glad you are happy",
afraid = "There is nothing to fear",
sad = "Cheer up",
angry = "Calm down now"
)
) # Listing 5.5 - mystats(): a user-written function for
# summary statistics
mystats <- function(x, parametric=TRUE, print=FALSE) {
if (parametric) {
center <- mean(x); spread <- sd(x)
} else {
center <- median(x); spread <- mad(x)
}
if (print & parametric) {
cat("Mean=", center, "\n", "SD=", spread, "\n")
} else if (print & !parametric) {
cat("Median=", center, "\n", "MAD=", spread, "\n")
}
result <- list(center=center, spread=spread)
return(result)
} # trying it out
set.seed(1234)
x <- rnorm(500)
y <- mystats(x)
y <- mystats(x, parametric=FALSE, print=TRUE) # mydate: a user-written function using switch
mydate <- function(type="long") {
switch(type,
long = format(Sys.time(), "%A %B %d %Y"),
short = format(Sys.time(), "%m-%d-%y"),
cat(type, "is not a recognized type\n"))
}
mydate("long")
mydate("short")
mydate()
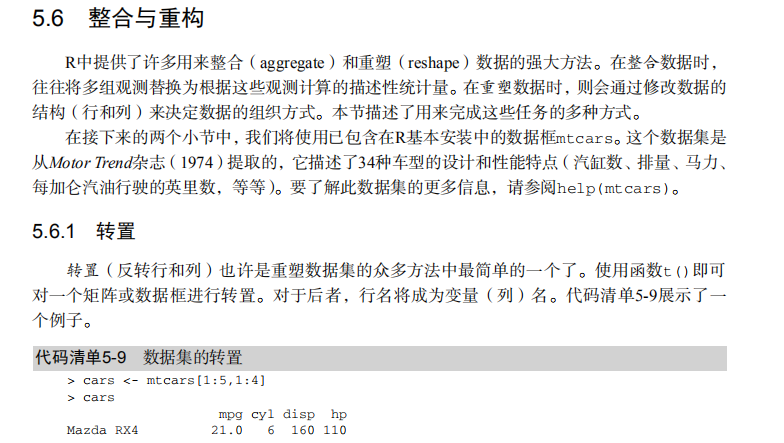
mydate("medium") # Listing 5.9 - Transposing a dataset
cars <- mtcars[1:5, 1:4]
cars
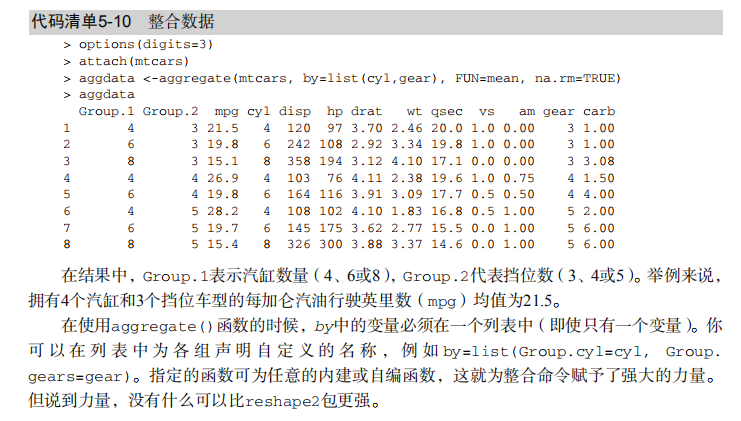
t(cars) # Listing 5.10 - Aggregating data
options(digits=3)
attach(mtcars)
aggdata <-aggregate(mtcars, by=list(cyl,gear),
FUN=mean, na.rm=TRUE)
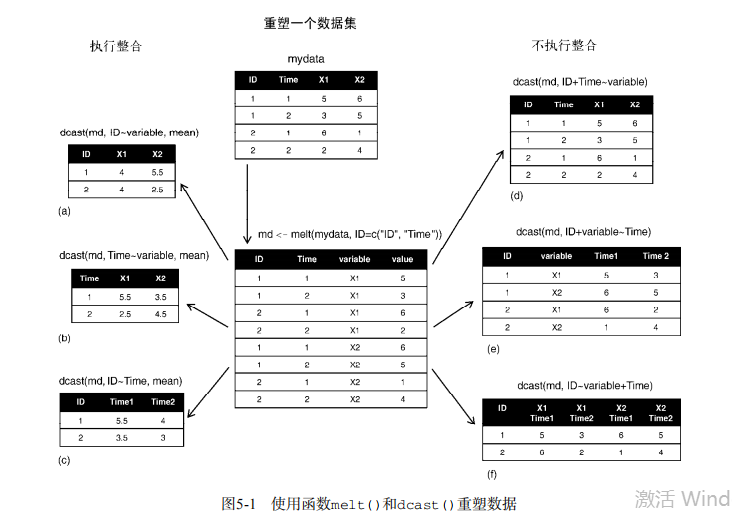
aggdata # Using the reshape2 package
library(reshape2) # input data
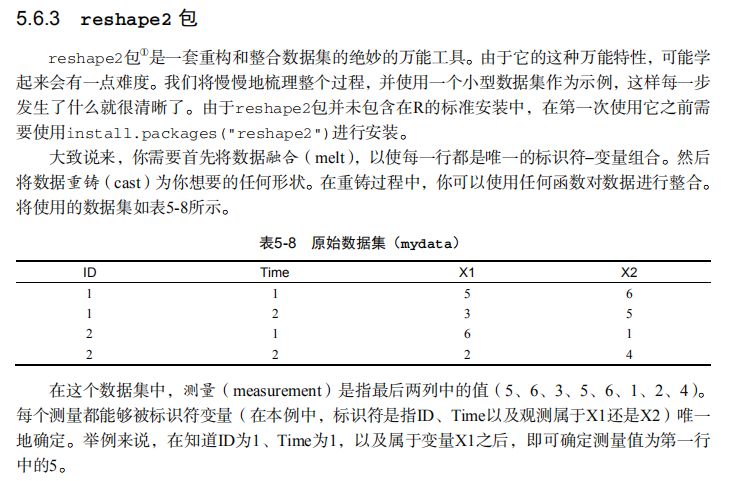
mydata <- read.table(header=TRUE, sep=" ", text="
ID Time X1 X2
1 1 5 6
1 2 3 5
2 1 6 1
2 2 2 4
") # melt data
md <- melt(mydata, id=c("ID", "Time")) # reshaping with aggregation
dcast(md, ID~variable, mean)
dcast(md, Time~variable, mean)
dcast(md, ID~Time, mean) # reshaping without aggregation
dcast(md, ID+Time~variable)
dcast(md, ID+variable~Time)
dcast(md, ID~variable+Time)
吴裕雄--天生自然 R语言开发学习:高级数据管理(续三)的更多相关文章
- 吴裕雄--天生自然 R语言开发学习:R语言的安装与配置
下载R语言和开发工具RStudio安装包 先安装R
- 吴裕雄--天生自然 R语言开发学习:数据集和数据结构
数据集的概念 数据集通常是由数据构成的一个矩形数组,行表示观测,列表示变量.表2-1提供了一个假想的病例数据集. 不同的行业对于数据集的行和列叫法不同.统计学家称它们为观测(observation)和 ...
- 吴裕雄--天生自然 R语言开发学习:导入数据
2.3.6 导入 SPSS 数据 IBM SPSS数据集可以通过foreign包中的函数read.spss()导入到R中,也可以使用Hmisc 包中的spss.get()函数.函数spss.get() ...
- 吴裕雄--天生自然 R语言开发学习:使用键盘、带分隔符的文本文件输入数据
R可从键盘.文本文件.Microsoft Excel和Access.流行的统计软件.特殊格 式的文件.多种关系型数据库管理系统.专业数据库.网站和在线服务中导入数据. 使用键盘了.有两种常见的方式:用 ...
- 吴裕雄--天生自然 R语言开发学习:R语言的简单介绍和使用
假设我们正在研究生理发育问 题,并收集了10名婴儿在出生后一年内的月龄和体重数据(见表1-).我们感兴趣的是体重的分 布及体重和月龄的关系. 可以使用函数c()以向量的形式输入月龄和体重数据,此函 数 ...
- 吴裕雄--天生自然 R语言开发学习:基础知识
1.基础数据结构 1.1 向量 # 创建向量a a <- c(1,2,3) print(a) 1.2 矩阵 #创建矩阵 mymat <- matrix(c(1:10), nrow=2, n ...
- 吴裕雄--天生自然 R语言开发学习:图形初阶(续二)
# ----------------------------------------------------# # R in Action (2nd ed): Chapter 3 # # Gettin ...
- 吴裕雄--天生自然 R语言开发学习:图形初阶(续一)
# ----------------------------------------------------# # R in Action (2nd ed): Chapter 3 # # Gettin ...
- 吴裕雄--天生自然 R语言开发学习:图形初阶
# ----------------------------------------------------# # R in Action (2nd ed): Chapter 3 # # Gettin ...
- 吴裕雄--天生自然 R语言开发学习:基本图形(续二)
#---------------------------------------------------------------# # R in Action (2nd ed): Chapter 6 ...
随机推荐
- win10 编译好的CPU版本caffe 配置自己的图像分类C++DEMO
VC++目录 包含目录 F:\caffewindows\scripts\build\include F:\caffewindows\scripts\build F:\vs2015\VC\include ...
- 关于 TCP 和 UDP 协议
TCP\UDP 两者区别总结:https://blog.csdn.net/striveb/article/details/84063712 图解HTTP,状态码,TCP.UDP等网络协议相关总结(持续 ...
- flutter 命令卡主的问题
情况 1 镜像的问题 如果你的镜像已经设置,却仍然卡主,那么请参考情况 2 这种情况在中文官网上已经有了,并且有这修改镜像的方法,附上链接: https://flutter.cn/community/ ...
- 启动查看crontab日志服务
方法1: . 修改rsyslog文件,将/etc/rsyslog.d/-default.conf 文件中的#cron.*前的#删掉: . 重启rsyslog服务service rsyslog rest ...
- android课程表控件、悬浮窗、Todo应用、MVP框架、Kotlin完整项目源码
Android精选源码 Android游戏2048 MVP Kotlin项目(RxJava+Rerotfit+OkHttp+Glide) Android基于自定义Span的富文本编辑器 android ...
- Qt LNK1112: 模块计算机类型“x64”与目标计算机类型“X86”冲突问题
解决方法:1.找到选项: 2.点击构建套件kit,选择x86_amd64,之后便不会出现类似问题了
- 系统学习Javaweb6----JavaScript2
感想:感觉自己还是只是学到皮毛,仍需继续努力,明天开始需要学习Android和阅读感想的书写. 学习笔记: 2.3.运算符 JavaScript运算符与java运算符基本一致. 这里我们来寻找不同点进 ...
- 系统学习javaweb重点难点2--.JavaScript中的正则对象简述和正则对象使用注意事项。
注意:只是简述,对正则对象的了解目前还不是很深刻,日后详细了解了再来修改. 正文: 正则对象 首先,我们要了解一下什么是正则对象: 正则表达式,又称规则表达式.(英语:Regular Expressi ...
- java 解析URL里的主域名及参数工具类
java 解析URL里的协议及参数工具类,解析URL中的主域名,并统一把协议修改成http或去掉协议 public class UrlDomainUtils { private static fina ...
- Memcache工作原理
1 Memcache是什么 Memcache是danga.com的一个项目,最早是为 LiveJournal 服务的,目前全世界不少人使用这个缓存项目来构建自己大负载的网站,来分担数据库的 ...