Python数据可视化——使用Matplotlib创建散点图
Python数据可视化——使用Matplotlib创建散点图
2017-12-27
作者:淡水化合物
| 飞行里程数 | 游戏耗时百分比 | 冰淇淋公升数 | 分类结果 |
| 40920 | 8.326976 | 0.953952 | 3 |
| 14488 | 7.153469 | 1.673904 | 2 |
| 26052 | 1.441871 | 0.805124 | 1 |
| ...... | ...... | ...... | ...... |
数据在datingTestSet2.txt文件中的格式如下所示:
from numpy import *

def file2matrix(filename):

    fr = open(filename)

    numberOfLines = len(fr.readlines()) # get the number of lines in the file

    returnMat = zeros((numberOfLines, 3)) # prepare matrix to return

    classLabelVector = []  # prepare labels return

    fr = open(filename)

    index = 0

    for line in fr.readlines():

        line = line.strip()

        listFromLine = line.split('\t')

        returnMat[index, :] = listFromLine[0:3]

        classLabelVector.append(int(listFromLine[-1]))

        index += 1

    return returnMat, classLabelVector
使用file2matrix读取文件数据,必须确保待解析文件存储在当前的工作目录中。导入数据之后,简单检查一下数据格式:
>>>import kNN

>>>datingDataMat,datingLabels = kNN.file2matrix('datingTestSet2.txt')

>>>datingDataMat[0:6]

array([[  4.09200000e+04,   8.32697600e+00,   9.53952000e-01],

       [  1.44880000e+04,   7.15346900e+00,   1.67390400e+00],

       [  2.60520000e+04,   1.44187100e+00,   8.05124000e-01],

       [  7.51360000e+04,   1.31473940e+01,   4.28964000e-01],

       [  3.83440000e+04,   1.66978800e+00,   1.34296000e-01],

       [  7.29930000e+04,   1.01417400e+01,   1.03295500e+00]])

>>> datingLabels[0:6]

[3, 2, 1, 1, 1, 1]
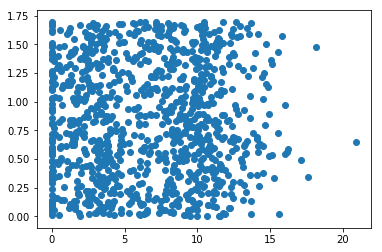
分析数据:使用Matplotlib创建散点图
>>> import matplotlib

>>> import matplotlib.pyplot as plt

>>> fig = plt.figure()

>>> ax = fig.add_subplot(111)

>>> ax.scatter(datingDataMat[:,1],datingDataMat[:,2])

<matplotlib.collections.PathCollection object at 0x0000019E14C9A470>

>>> plt.show()

>>>
生成的散点图如下:
import matplotlib

import numpy as np

from numpy import *

from matplotlib import pyplot as plt

def file2matrix(filename):

    fr = open(filename)

    numberOfLines = len(fr.readlines())  # get the number of lines in the file

    returnMat = zeros((numberOfLines, 3))  # prepare matrix to return

    classLabelVector = []  # prepare labels return

    fr = open(filename)

    index = 0

    for line in fr.readlines():

        line = line.strip()

        listFromLine = line.split('\t')

        returnMat[index, :] = listFromLine[0:3]

        classLabelVector.append(int(listFromLine[-1]))

        index += 1

    return returnMat, classLabelVector

datingDataMat,datingLabels = file2matrix('datingTestSet2.txt')

fig = plt.figure()

ax = plt.subplot(111)

ax.scatter(datingDataMat[:,1],datingDataMat[:,2])

plt.show()
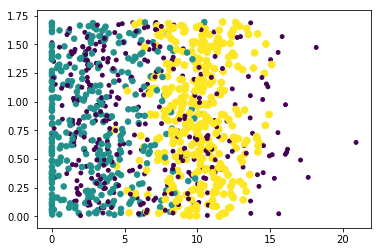
上图由于没有使用样本分类的特征值,很难看到任何有用的数据模式信息。为了更好理解数据信息,Matplotlib库提供的scatter函数支持个性化标记散点图上的点。调用scatter函数使用下列参数:
ax.scatter(datingDataMat[:,1],datingDataMat[:,2],15.0*array(datingLabels),15.0*array(datingLabels))
生成的散点图如下:
import matplotlib
import numpy as np
from numpy import *
from matplotlib import pyplot as plt
from matplotlib.font_manager import FontProperties def file2matrix(filename):
fr = open(filename)
numberOfLines = len(fr.readlines()) # get the number of lines in the file
returnMat = zeros((numberOfLines, 3)) # prepare matrix to return
classLabelVector = [] # prepare labels return
fr = open(filename)
index = 0
for line in fr.readlines():
line = line.strip()
listFromLine = line.split('\t')
returnMat[index, :] = listFromLine[0:3]
classLabelVector.append(int(listFromLine[-1]))
index += 1
return returnMat, classLabelVector
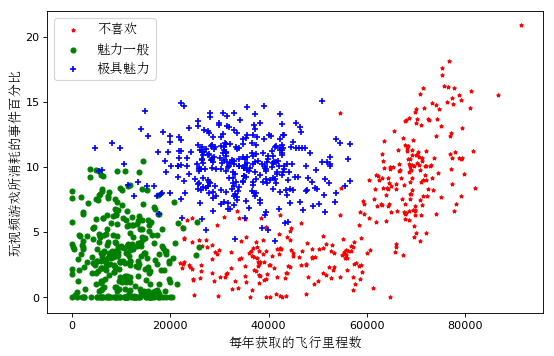
zhfont = FontProperties(fname='C:/Windows/Fonts/simsun.ttc',size=12) datingDataMat,datingLabels = file2matrix('datingTestSet2.txt')
fig = plt.figure() plt.figure(figsize=(8, 5), dpi=80)
ax = plt.subplot(111) datingLabels = np.array(datingLabels)
idx_1 = np.where(datingLabels==1)
p1 = ax.scatter(datingDataMat[idx_1,0],datingDataMat[idx_1,1],marker = '*',color = 'r',label='',s=10)
idx_2 = np.where(datingLabels==2)
p2 = ax.scatter(datingDataMat[idx_2,0],datingDataMat[idx_2,1],marker = 'o',color ='g',label='',s=20)
idx_3 = np.where(datingLabels==3)
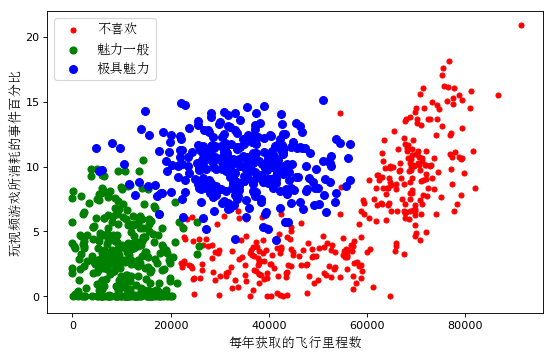
p3 = ax.scatter(datingDataMat[idx_3,0],datingDataMat[idx_3,1],marker = '+',color ='b',label='',s=30) plt.xlabel(u'每年获取的飞行里程数', fontproperties=zhfont)
plt.ylabel(u'玩视频游戏所消耗的事件百分比', fontproperties=zhfont)
ax.legend((p1, p2, p3), (u'不喜欢', u'魅力一般', u'极具魅力'), loc=2, prop=zhfont)
plt.show()
生成的散点图如下:
第二种方法:
import matplotlib

from matplotlib import pyplot as plt

from matplotlib import font_manager

def file2matrix(filename):

    fr = open(filename)

    numberOfLines = len(fr.readlines())  # get the number of lines in the file

    returnMat = zeros((numberOfLines, 3))  # prepare matrix to return

    classLabelVector = []  # prepare labels return

    fr = open(filename)

    index = 0

    for line in fr.readlines():

        line = line.strip()

        listFromLine = line.split('\t')

        returnMat[index, :] = listFromLine[0:3]

        classLabelVector.append(int(listFromLine[-1]))

        index += 1

    return returnMat, classLabelVector

matrix, labels = file2matrix('datingTestSet2.txt')

zhfont = matplotlib.font_manager.FontProperties(fname='C:/Windows/Fonts/simsun.ttc',size=12)

plt.figure(figsize=(8, 5), dpi=80)

axes = plt.subplot(111)

# 将三类数据分别取出来

# x轴代表飞行的里程数

# y轴代表玩视频游戏的百分比

type1_x = []

type1_y = []

type2_x = []

type2_y = []

type3_x = []

type3_y = []

for i in range(len(labels)):

    if labels[i] == 1:  # 不喜欢

        type1_x.append(matrix[i][0])

        type1_y.append(matrix[i][1])

    if labels[i] == 2:  # 魅力一般

        type2_x.append(matrix[i][0])

        type2_y.append(matrix[i][1])

    if labels[i] == 3:  # 极具魅力

        #print (i, ':', labels[i], ':', type(labels[i]))

        type3_x.append(matrix[i][0])

        type3_y.append(matrix[i][1])

type1 = axes.scatter(type1_x, type1_y, s=20, c='red')

type2 = axes.scatter(type2_x, type2_y, s=40, c='green')

type3 = axes.scatter(type3_x, type3_y, s=50, c='blue')

plt.xlabel(u'每年获取的飞行里程数', fontproperties=zhfont)

plt.ylabel(u'玩视频游戏所消耗的事件百分比', fontproperties=zhfont)

axes.legend((type1, type2, type3), (u'不喜欢', u'魅力一般', u'极具魅力'), loc=2, prop=zhfont)

plt.show()
生成的散点图如下:
# -*- coding: utf-8 -*-

import matplotlib.pyplot as plt

import matplotlib

zhfont1 = matplotlib.font_manager.FontProperties(fname='C:/Windows/Fonts/simsun.ttc')

plt.xlabel(u"横坐标xlabel",fontproperties=zhfont1)
到C:\Windows\Fonts\中找到新宋体对应的字体文件simsun.ttf(Window 8和Windows10系统是simsun.ttc,也可以使用其他字体)
Python数据可视化——使用Matplotlib创建散点图的更多相关文章
- python 数据可视化(matplotlib)
matpotlib 官网 :https://matplotlib.org/index.html matplotlib 可视化示例:https://matplotlib.org/gallery/inde ...
- Python数据可视化库-Matplotlib(一)
今天我们来学习一下python的数据可视化库,Matplotlib,是一个Python的2D绘图库 通过这个库,开发者可以仅需要几行代码,便可以生成绘图,直方图,功率图,条形图,错误图,散点图等等 废 ...
- Python数据可视化之Matplotlib实现各种图表
数据分析就是将数据以各种图表的形式展现给领导,供领导做决策用,因此熟练掌握饼图.柱状图.线图等图表制作是一个数据分析师必备的技能.Python有两个比较出色的图表制作框架,分别是Matplotlib和 ...
- Python数据可视化利器Matplotlib,绘图入门篇,Pyplot介绍
Pyplot matplotlib.pyplot是一个命令型函数集合,它可以让我们像使用MATLAB一样使用matplotlib.pyplot中的每一个函数都会对画布图像作出相应的改变,如创建画布.在 ...
- Python数据可视化之matplotlib
常用模块导入 import numpy as np import matplotlib import matplotlib.mlab as mlab import matplotlib.pyplot ...
- 《机器学习实战》2.2.2分析数据:使用matplotlib创建散点图
#输出散点图 def f(): datingDataMat,datingLabels = file2matrix("datingTestSet3.txt") fig = plt.f ...
- Python数据可视化库-Matplotlib(二)
我们接着上次的继续讲解,先讲一个概念,叫子图的概念. 我们先看一下这段代码 import matplotlib.pyplot as plt fig = plt.figure() ax1 = fig.a ...
- python数据可视化(matplotlib)
- Python的可视化包 – Matplotlib 2D图表(点图和线图,.柱状或饼状类型的图),3D图表(曲面图,散点图和柱状图)
Python的可视化包 – Matplotlib Matplotlib是Python中最常用的可视化工具之一,可以非常方便地创建海量类型地2D图表和一些基本的3D图表.Matplotlib最早是为了可 ...
随机推荐
- MES制造执行系统启动篇
美国先进制造研究机构(AMR)定义了MES为:"位于上层的计划管理系统与底层的工业控制之间的面向车间层的管理信息系统",它为操作人员/管理人员提供计划的执行.跟踪以及所有资源(人. ...
- OpenTSDB - 分布式可扩展的监控系统
OpenTSDB - A Distributed, Scalable Monitoring System http://opentsdb.net/getting-started.html http:/ ...
- Kaggle实战之一回归问题
0. 前言 1.任务描述 2.数据概览 3. 数据准备 4. 模型训练 5. kaggle实战 0. 前言 "尽管新技术新算法层出不穷,但是掌握好基础算法就能解决手头 90% 的机器学习问题 ...
- [最短路]P1339 [USACO09OCT]热浪Heat Wave
题目描述 The good folks in Texas are having a heatwave this summer. Their Texas Longhorn cows make for g ...
- AIO5打印样式函数说明
函数名称 描述 _RM_Column 返回当前栏目数. _RM_Line 返回数据行数(从分组的起始位置开始) _RM_LineThough 返回数据行数(从报表的起始位置开始) _RM_Page 返 ...
- Struts 2 入门
Struts 2 入门: 一:Struts 2执行流程: 1 客户端发送请求: 2这个请求经过一系列的过滤器(Filter)(这些过滤器中有一个叫做ActionContextCleanUp的可选过滤 ...
- ChatterBot之快速入门01
本人运行环境为Python 3.5.2; 首先你需要导入chatterbot 的包,如果没有你先需要下载 使用命令 pip install chatterbot 1 # -*- coding: utf ...
- TensorFlow —— Demo
import tensorflow as tf g = tf.Graph() # 创建一个Graph对象 在模型中有两个"全局"风格的Variable对象:global_step ...
- (高级篇)php结合redis实现高并发下的抢购、秒杀功能
抢购.秒杀是如今很常见的一个应用场景,主要需要解决的问题有两个:1 高并发对数据库产生的压力2 竞争状态下如何解决库存的正确减少("超卖"问题)对于第一个问题,已经很容易想到用缓存 ...
- Natural Hazards 隐私政策
隐私政策 本应用尊重并保护所有使用服务用户的个人隐私权.为了给您提供更准确.更有个性化的服务,本应用会按照本隐私权政策的规定使用和披露您的个人信息.但本应用将以高度的勤勉.审慎义务对待这些信息.除本隐 ...