《DSP using MATLAB》示例Example4.15
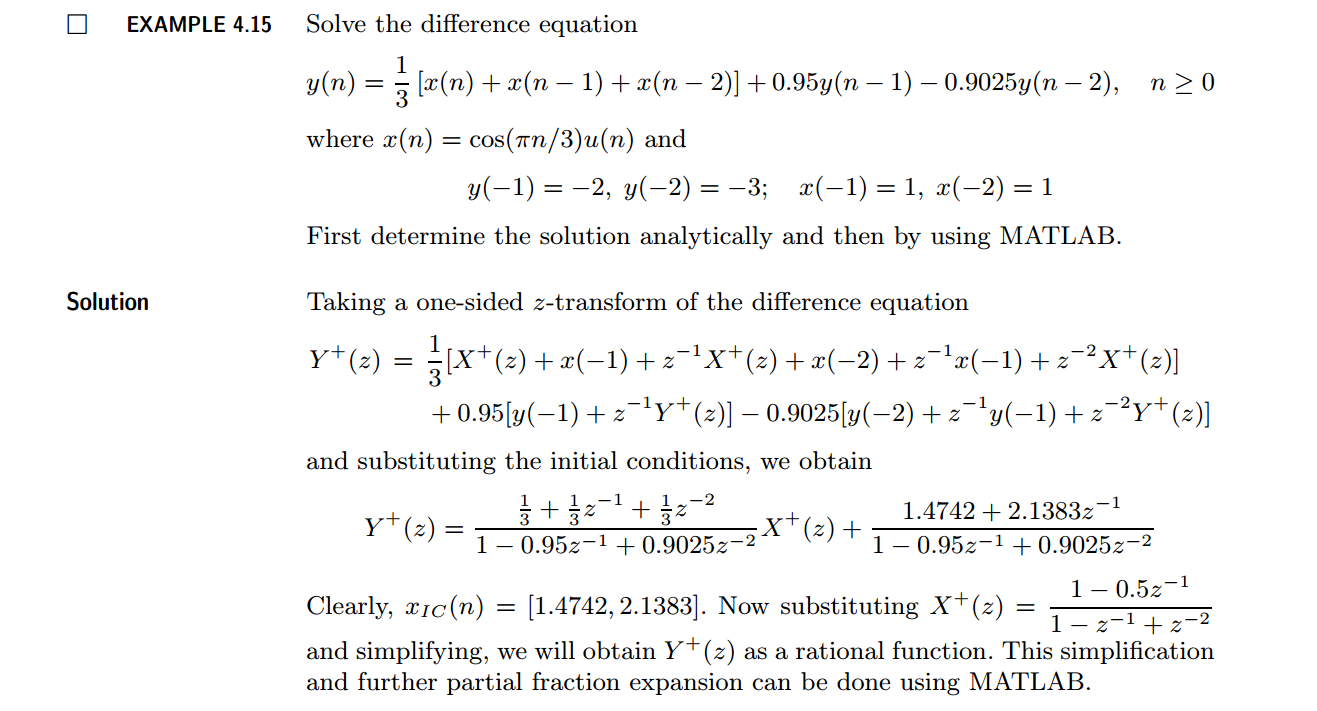
代码:
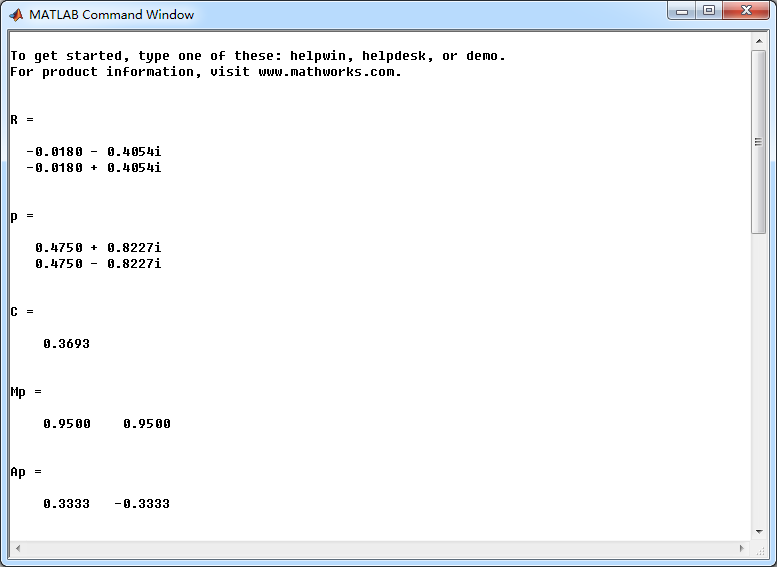
b = [1/3, 1/3, 1/3]; a = [1, -0.95, 0.9025]; % x(n) y(n) coefficient [R, p, C] = residuez(b,a) Mp = (abs(p))', Ap = (angle(p))'/pi % polar form Y = [-2, -3]; X =[1, 1]; xic = filtic(b,a,Y,X); %% ----------------------------------------------
%% START a determine H(z) and sketch
%% ----------------------------------------------
figure('NumberTitle', 'off', 'Name', 'Example4.15 H(z) its pole-zero plot')
set(gcf,'Color','white');
zplane(b,a);
title('pole-zero plot'); grid on; %% ----------------------------------------------
%% END
%% ---------------------------------------------- bxplus = [1, -0.5]; axplus = [1, -1, 1]; % X(z) transform coeff
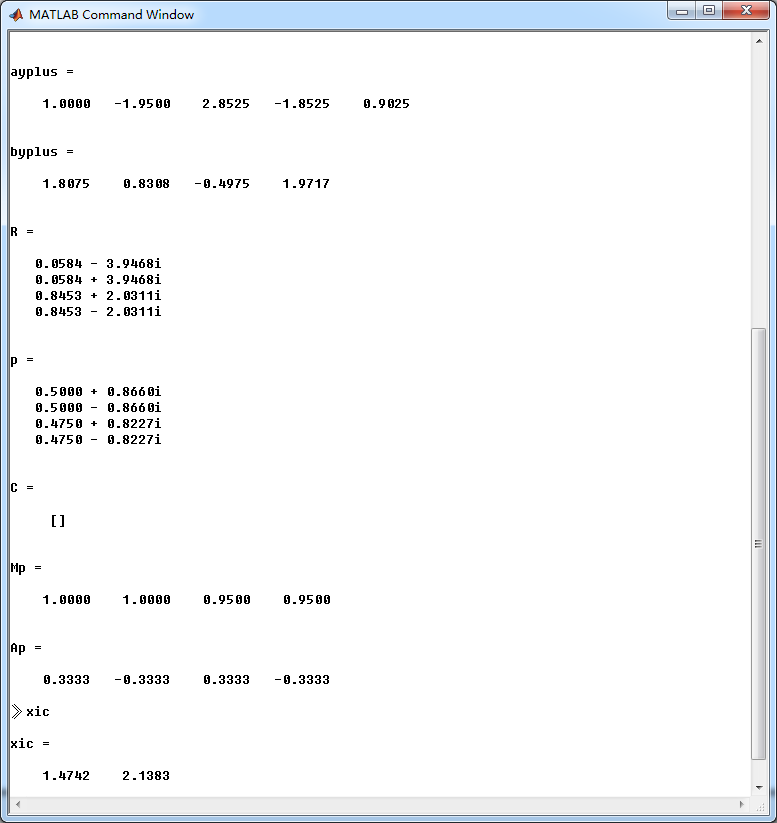
ayplus = conv(a, axplus) % Denominator of Yplus(z)
byplus = conv(b,bxplus) + conv(xic,axplus) % Numerator of Yplus(z) [R, p, C] = residuez(byplus, ayplus)
Mp = (abs(p))' , Ap = (angle(p))'/pi % polar form %% --------------------------------------------------------------
%% START b |H| <H
%% 1st form of freqz
%% --------------------------------------------------------------
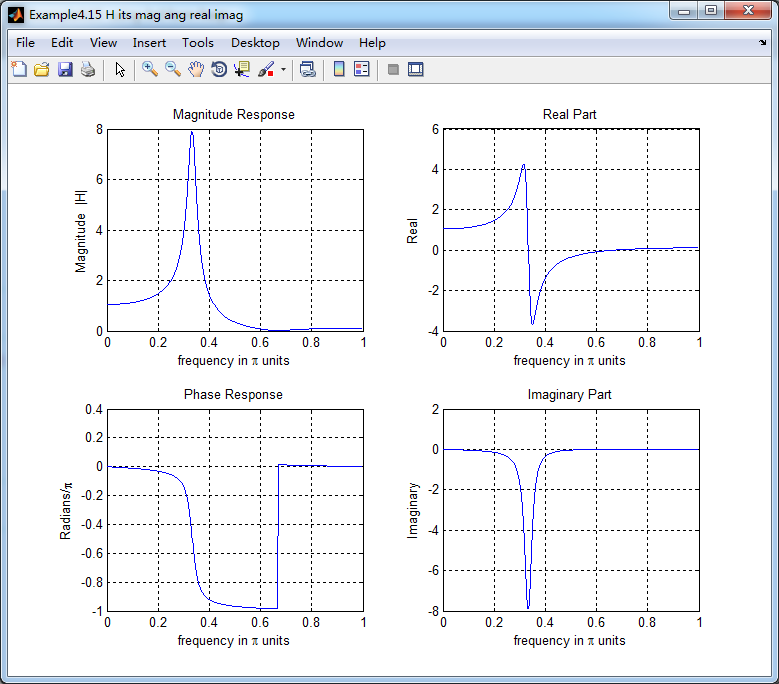
[H,w] = freqz(b,a,500); % 1st form of freqz magH = abs(H); angH = angle(H); realH = real(H); imagH = imag(H); %% ================================================
%% START H's mag ang real imag
%% ================================================
figure('NumberTitle', 'off', 'Name', 'Example4.15 H its mag ang real imag');
set(gcf,'Color','white');
subplot(2,2,1); plot(w/pi,magH); grid on; %axis([0,1,0,1.5]);
title('Magnitude Response');
xlabel('frequency in \pi units'); ylabel('Magnitude |H|');
subplot(2,2,3); plot(w/pi, angH/pi); grid on; % axis([-1,1,-1,1]);
title('Phase Response');
xlabel('frequency in \pi units'); ylabel('Radians/\pi'); subplot('2,2,2'); plot(w/pi, realH); grid on;
title('Real Part');
xlabel('frequency in \pi units'); ylabel('Real');
subplot('2,2,4'); plot(w/pi, imagH); grid on;
title('Imaginary Part');
xlabel('frequency in \pi units'); ylabel('Imaginary');
%% ==================================================
%% END H's mag ang real imag
%% ================================================== %% ---------------------------------------------------------------
%% END b |H| <H
%% --------------------------------------------------------------- %% --------------------------------------------------------------
%% START b |H| <H
%% 3rd form of freqz
%% --------------------------------------------------------------
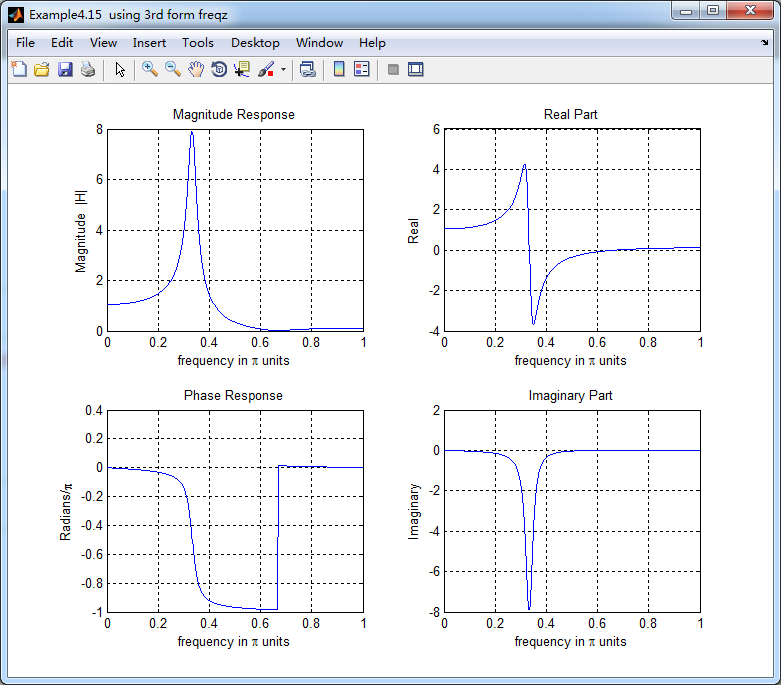
w = [0:1:500]*pi/500; H = freqz(b,a,w);
%[H,w] = freqz(b,a,200,'whole'); % 3rd form of freqz magH = abs(H); angH = angle(H); realH = real(H); imagH = imag(H); %% ================================================
%% START H's mag ang real imag
%% ================================================
figure('NumberTitle', 'off', 'Name', 'Example4.15 using 3rd form freqz ');
set(gcf,'Color','white');
subplot(2,2,1); plot(w/pi,magH); grid on; %axis([0,1,0,1.5]);
title('Magnitude Response');
xlabel('frequency in \pi units'); ylabel('Magnitude |H|');
subplot(2,2,3); plot(w/pi, angH/pi); grid on; % axis([-1,1,-1,1]);
title('Phase Response');
xlabel('frequency in \pi units'); ylabel('Radians/\pi'); subplot('2,2,2'); plot(w/pi, realH); grid on;
title('Real Part');
xlabel('frequency in \pi units'); ylabel('Real');
subplot('2,2,4'); plot(w/pi, imagH); grid on;
title('Imaginary Part');
xlabel('frequency in \pi units'); ylabel('Imaginary');
%% ==================================================
%% END H's mag ang real imag
%% ================================================== %% ---------------------------------------------------------------
%% END b |H| <H
%% --------------------------------------------------------------- %% START Check
n = [0:7]; x = cos(pi*n/3); y_ori = filter(b,a,x,xic) %% MATLAB verification
A = real(2*R(1)); B = imag(2*R(1)); C = real(2*R(3)); D = imag(2*R(4));
y_check = A*cos(pi*n/3) + B *sin(pi*n/3) + ((0.95).^n) .* (C*cos(pi*n/3) + D*sin(pi*n/3))
结果:
《DSP using MATLAB》示例Example4.15的更多相关文章
- DSP using MATLAB 示例 Example3.15
上代码: subplot(1,1,1); b = 1; a = [1, -0.8]; n = [0:100]; x = cos(0.05*pi*n); y = filter(b,a,x); figur ...
- DSP using MATLAB 示例Example3.21
代码: % Discrete-time Signal x1(n) % Ts = 0.0002; n = -25:1:25; nTs = n*Ts; Fs = 1/Ts; x = exp(-1000*a ...
- DSP using MATLAB 示例 Example3.19
代码: % Analog Signal Dt = 0.00005; t = -0.005:Dt:0.005; xa = exp(-1000*abs(t)); % Discrete-time Signa ...
- DSP using MATLAB示例Example3.18
代码: % Analog Signal Dt = 0.00005; t = -0.005:Dt:0.005; xa = exp(-1000*abs(t)); % Continuous-time Fou ...
- DSP using MATLAB 示例 Example3.11
用到的性质 上代码: n = -5:10; x = rand(1,length(n)); k = -100:100; w = (pi/100)*k; % freqency between -pi an ...
- DSP using MATLAB 示例Example3.9
用到的性质 上代码: n = 0:100; x = cos(pi*n/2); k = -100:100; w = (pi/100)*k; % freqency between -pi and +pi ...
- DSP using MATLAB 示例Example3.8
代码: x = rand(1,11); n = 0:10; k = 0:500; w = (pi/500)*k; % [0,pi] axis divided into 501 points. X = ...
- DSP using MATLAB 示例Example3.7
上代码: x1 = rand(1,11); x2 = rand(1,11); n = 0:10; alpha = 2; beta = 3; k = 0:500; w = (pi/500)*k; % [ ...
- DSP using MATLAB示例Example3.6
代码: n = [-5:5]; x = (-0.9).^n; % x(n) = k = -200:200; w = (pi/100)*k; % [0,pi] axis divided into 101 ...
随机推荐
- WP8 双击返回键退出
bool isExit = false; // 构造函数 public MainPage() { InitializeComponent(); isExit = false; // 用于本地化 App ...
- 【编程题目】n 支队伍比赛,分别编号为 0,1,2。。。。n-1,已知它们之间的实力对比关系,
36.引用自网友:longzuo(运算)谷歌笔试: 19n 支队伍比赛,分别编号为 0,1,2....n-1,已知它们之间的实力对比关系,存储在一个二维数组 w[n][n]中,w[i][j] 的值代表 ...
- 【Excel 4.0 函数】REGISTER 的两种形式以及VBA等效语句
形式1 REGISTER("SAMPLE.DLL", "MyFunction", "AIC") 形式1等效 VBA语句 Declare Fu ...
- 由浅入深剖析.htaccess
转自:http://blog.csdn.net/21aspnet/article/details/6908025 [-] htaccess文件使用前提 htaccess基本语法介绍 现学现用学习正则表 ...
- XML 数据请求与JSON 数据请求
(1)XML 数据请求 使用 AFNetworking 中的 AFHTTPRequestOperation 和 AFXMLParserResponseSerializer,另外结合第三方框架 XMLD ...
- struts.xml配置详解
struts.xml是我们在开发中利用率最高的文件,也是Struts2中最重要的配置文件. 一下分别介绍一下几个struts.xml中常用到的标签 1.<include> 利用includ ...
- 内核中用于数据接收的结构体struct msghdr(转)
内核中用于数据接收的结构体struct msghdr(转) 我们从一个实际的数据包发送的例子入手,来看看其发送的具体流程,以及过程中涉及到的相关数据结构.在我们的虚拟机上发送icmp回显请求包,pin ...
- Java bean validation 规范与参考实现
1.Apache Bval 依赖包:validation-api-1.1.0.Final.jar org.apache.bval.bundle-1.1.1.jar bval-core-1.1.1.ja ...
- C#学习笔记----C#中的闭包机制
http://www.cnblogs.com/jiejie_peng/p/3701070.html http://www.cnblogs.com/Ribbon/p/3611457.html “ 若匿名 ...
- PHP 获取图像信息 getimagesize 函数
getimagesize() 函数用于获取图像尺寸,类型等信息. imagesx() 函数用于获取图像的宽度. imagesy() 函数用于获取图像的高度. getimagesize() getima ...