基于Docker+Prometheus+Grafana监控SpringBoot健康信息
在微服务体系当中,监控是必不可少的。当系统环境超过指定的阀值以后,需要提醒指定的运维人员或开发人员进行有效的防范,从而降低系统宕机的风险。在CNCF云计算平台中,Prometheus+Grafana是比较通用的解决方案,在SpringBoot2.0以后metrics默认与micrometer集成,而micrometer有关于Prometheus的MeterRegistry规范的实现,因此我们通过Micrometer这个桥梁能将SpringBoot的监控数据与Prometheus展示出来。然后通过Grafana提供的UI界面进行数据的实时展示。
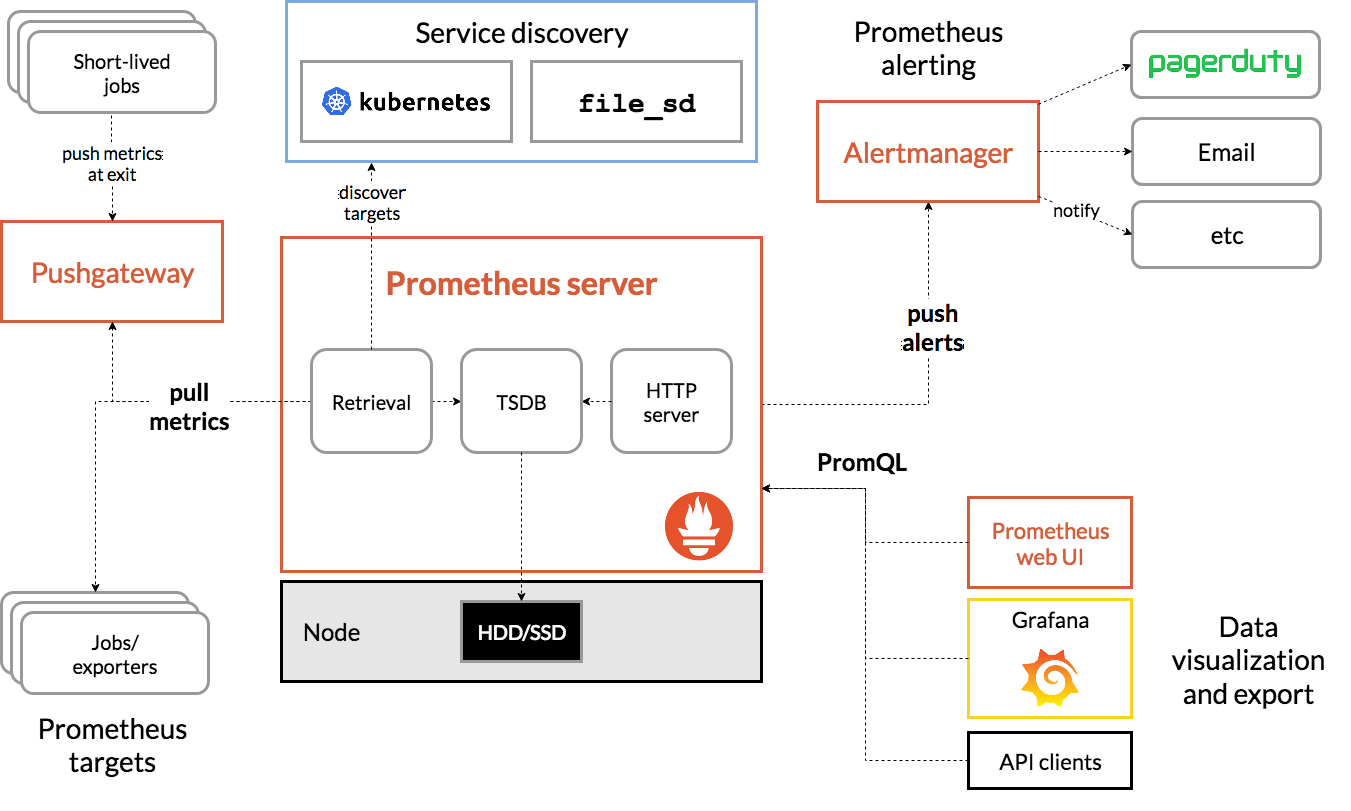
Prometheus从对应的节点地址获取度量数据并在本地存储所有数据样例根据相关规则将现有数据聚合并记录新的时间序列(或者生成警报)。可以使用Grafana或其他API消费者来可视化收集的数据。
1. 编写SpringBoot项目并用docker启动
1.1 gradle依赖
     compile 'org.springframework.boot:spring-boot-starter-actuator'

     compile 'io.micrometer:micrometer-registry-prometheus:latest.release'

     compile 'io.micrometer:micrometer-core:1.1.0'
1.2 开放prometheus的端点
在application.properties中编辑如下配置
management.endpoints.web.exposure.include=prometheus,health,info
1.3 配置与grafana集成所需的bean
    /**

         * 为了和grafana集成,因此必须配置这个bean

         * @return

         */

        @Bean

        MeterRegistryCustomizer<MeterRegistry> metricsCommonTags() {

            return registry -> registry.config().commonTags("application", "MYAPPNAME");

        }
具体可以参考:micrometer
1.4 编写docker-compose.yml文件启动spring-boot应用
docker-compose.yml
    version: '3'

    services:

      application:

        image: java

        working_dir: /apps

        volumes:

          - "${project.home}/build/libs:/apps"

        container_name: app

        networks:

          - node1

        hostname: application

        entrypoint: java -jar spring-boot-project-0.0.1-SNAPSHOT.jar

        ports:

          - "8080:8080"

    networks:

      node1:
当启动完毕后,我们可以运行如下命令来查看,是否有对应的信息输出:
curl -G http://localhost:8080/actuator/prometheus
当这里得到如下结果时,证明我们的SpringBoot项目提供好与prometheus所需的数据了:
    # HELP tomcat_global_request_max_seconds

    # TYPE tomcat_global_request_max_seconds gauge

    tomcat_global_request_max_seconds{application="spring-boot",name="http-nio-8080",} 0.0

    # HELP tomcat_sessions_created_sessions_total

    # TYPE tomcat_sessions_created_sessions_total counter

    tomcat_sessions_created_sessions_total{application="spring-boot",} 0.0

    # HELP jvm_gc_live_data_size_bytes Size of old generation memory pool after a full GC

    # TYPE jvm_gc_live_data_size_bytes gauge

    jvm_gc_live_data_size_bytes{application="spring-boot",} 1.9078616E7

    # HELP process_files_open_files The open file descriptor count

    # TYPE process_files_open_files gauge

    process_files_open_files{application="spring-boot",} 38.0

    # HELP tomcat_threads_current_threads

    # TYPE tomcat_threads_current_threads gauge

    tomcat_threads_current_threads{application="spring-boot",name="http-nio-8080",} 10.0

    # HELP jvm_gc_max_data_size_bytes Max size of old generation memory pool

    # TYPE jvm_gc_max_data_size_bytes gauge

    jvm_gc_max_data_size_bytes{application="spring-boot",} 3.49700096E8

    # HELP tomcat_servlet_request_seconds

    # TYPE tomcat_servlet_request_seconds summary

    tomcat_servlet_request_seconds_count{application="spring-boot",name="default",} 0.0
2 安装Prometheus
我们可以借助于docker进行安装,在这里由于springboot项目我也是使用docker进行部署的,因此我们保证Prometheus的容器与SpringBoot的容器保证在同一个网络下:
docker run --name prom --link app:app --net spring-boot-project_node1 --hostname prom -p 9090:9090 -v /tmp/prometheus.yml:/etc/prometheus/prometheus.yml prom/prometheus
安装完毕后,我们编辑/tmp/prometheus.yml文件进行配置:
    global:

      scrape_interval:     15s

      evaluation_interval: 15s

    rule_files:

      # - "first.rules"

      # - "second.rules"

    scrape_configs:

      - job_name: 'spring'

        metrics_path: '/actuator/prometheus'

        static_configs:

          - targets: ['application:8080']
在这里我们指定一个job,这个job会去指定的地址获取监控数据,那么在这里targets指定的是我们SpringBoot项目的actutator的监控地址,application对应的是springboot容器的hostname。
启动以后,我们运行http://localhost:9090 可以访问Prometheus的界面:


当出现这种界面就说明 Prometheus已经可以监控到Springboot的提供的数据了
3 安装Grafana
虽然Prometheus提供的有一个简单的UI界面,但是使用起来不那么方便同时也并不好看。不过,我们可以利用Grafana来提供更直接更美观的UI展示界面。同时,Grafana能够提供多种数据源,让我们进行不同类型的中间件或服务器监控。官网地址。同样我们使用docker来构建grafana容器。grafana所有的配置都在conf/grafana.ini里进行设置。不过它能通过docker的环境变量参数-e进行覆盖,它的基本格式为:GF_<SectionName>_<KeyName>。例如:
    $ docker run \

      -d \

      -p 3000:3000 \

      --name=grafana \

      --net=spring-boot-project_node1

      --link=prom

      -e "GF_SERVER_ROOT_URL=http://grafana.server.name" \

      -e "GF_SECURITY_ADMIN_PASSWORD=secret" \

      grafana/grafana
当启动完毕后,我们可以访问http://localhost:3000
可以访问到对应的界面,其默认情况下都会跳转至登录界面,我们可以在登录界面上输入用户名admin与密码admin,这样会以管理员身份进行登录。接下来我们需要创建一个prometheus的数据源:

此处我们设置prometheus的地址,这里我的设置为http://prom:9090 用以连接prometheus的监控(注意prom是docker容器prometheus的hostname),剩余的一些设置比如说Auth,Advanced HTTP Settings请按需进行配置。此时我们需要在这个地址里下一个用于监控micrometer的Dashboard:

我们需要下载这个dashboard对应的json数据:

然后我们在grafana上传json脚本:

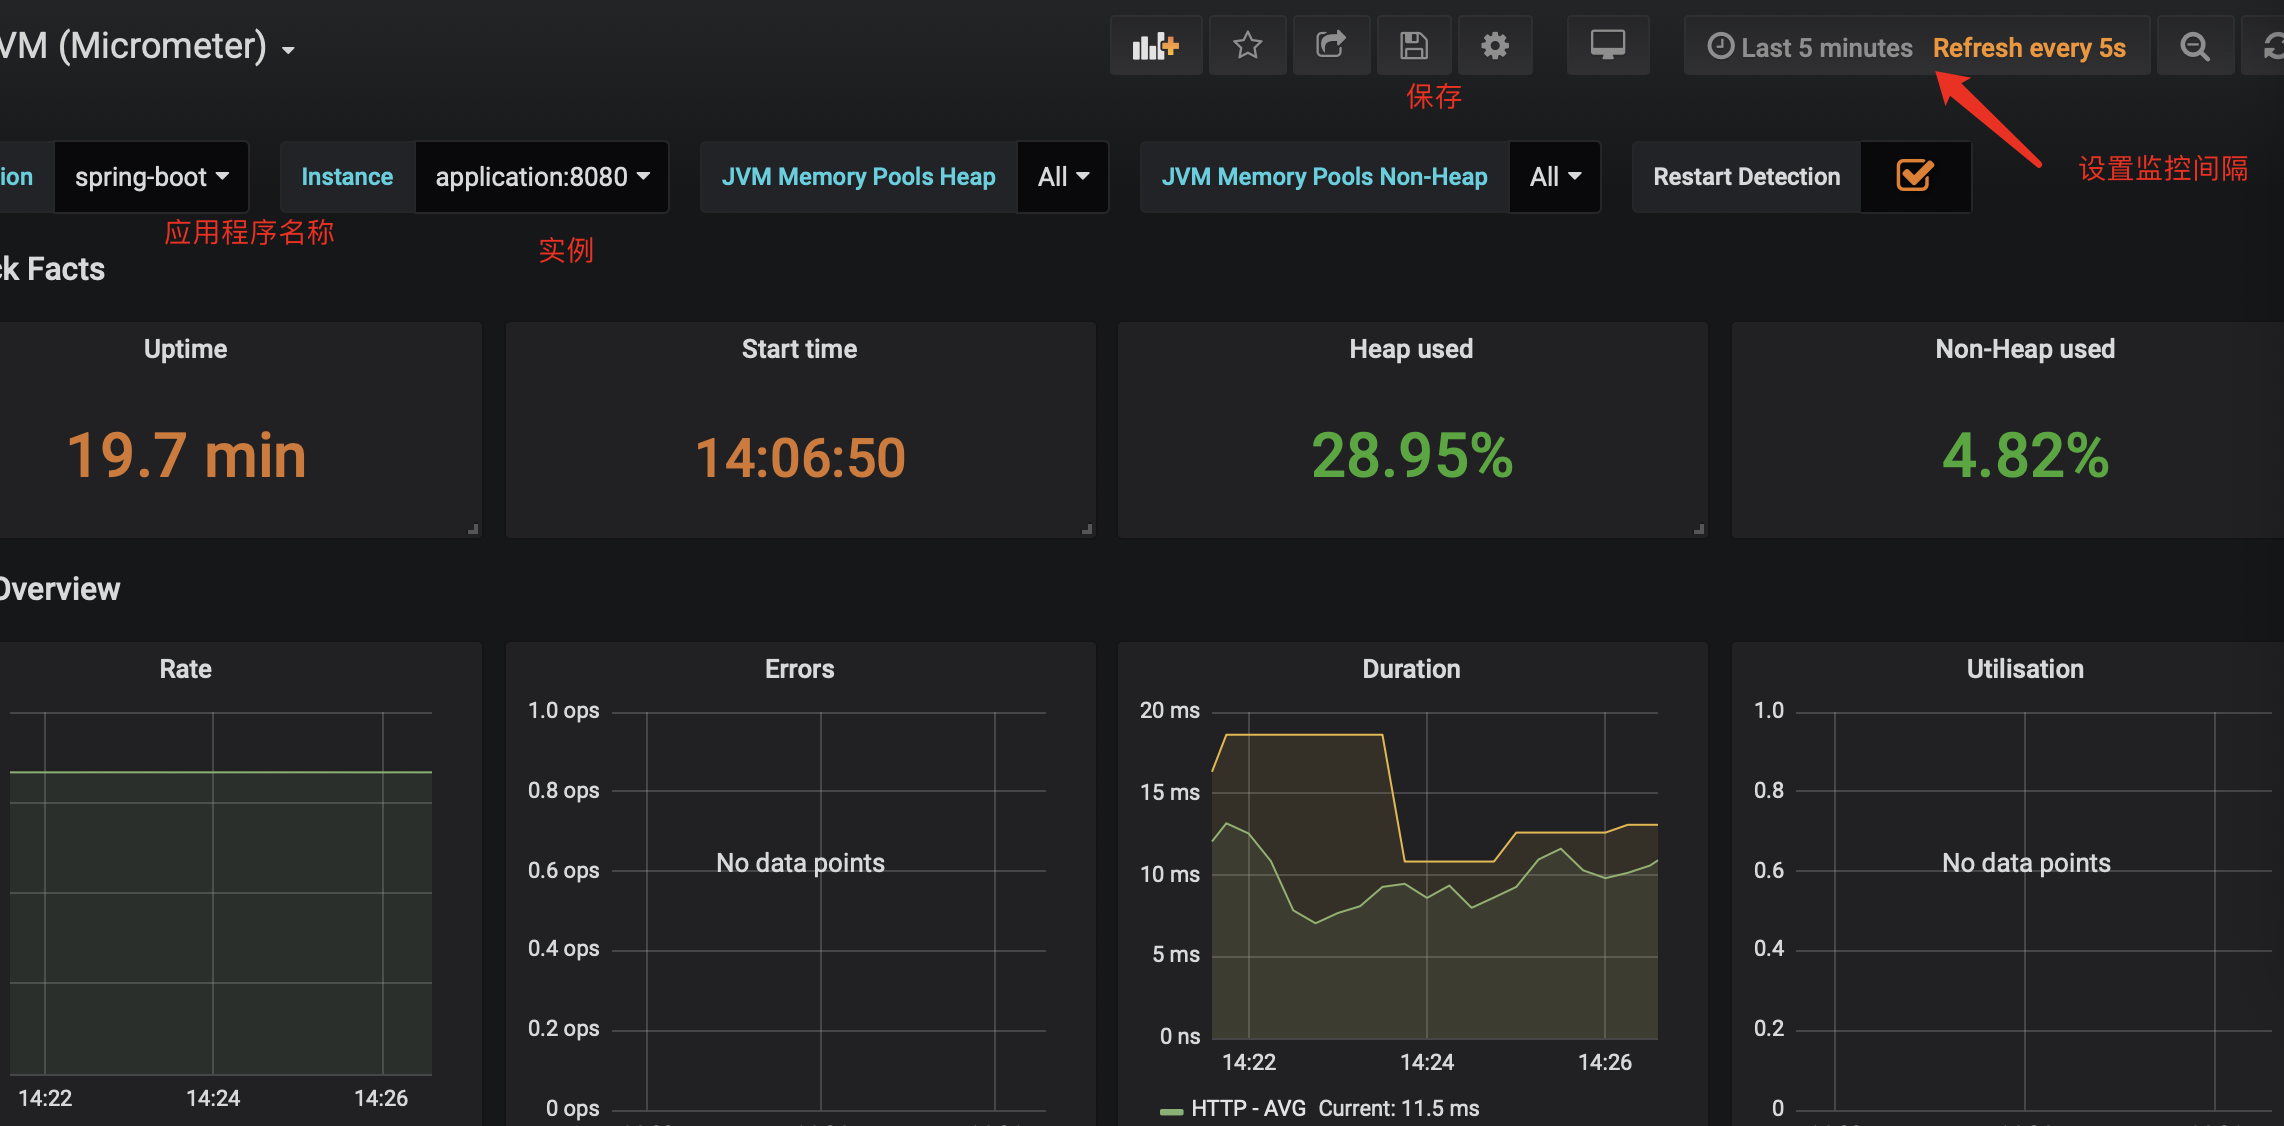
当导入成功后我们即可以展示出如下监控界面:
3.1 报警信息配置
在这里我以qq邮箱为例,首先我们必须开启smtp许可,在这里我们会收到安全码用于将来的密码设置。那么我们可以在docker启动容器时设置环境变量来配置邮件服务的信息:
docker run

-p 3000:3000

--env GF_SMTP_ENABLED=true

--env GF_SMTP_HOST=smtp.qq.com:465

--env GF_SMTP_USER=xxxx(用户名)

--env GF_SMTP_PASSWORD=(安全码)

--env GF_SMTP_SKIP_VERIFY=true

--env GF_SMTP_FROM_ADDRESS=xxxxx@qq.com

--name grafana

grafana/grafana:latest
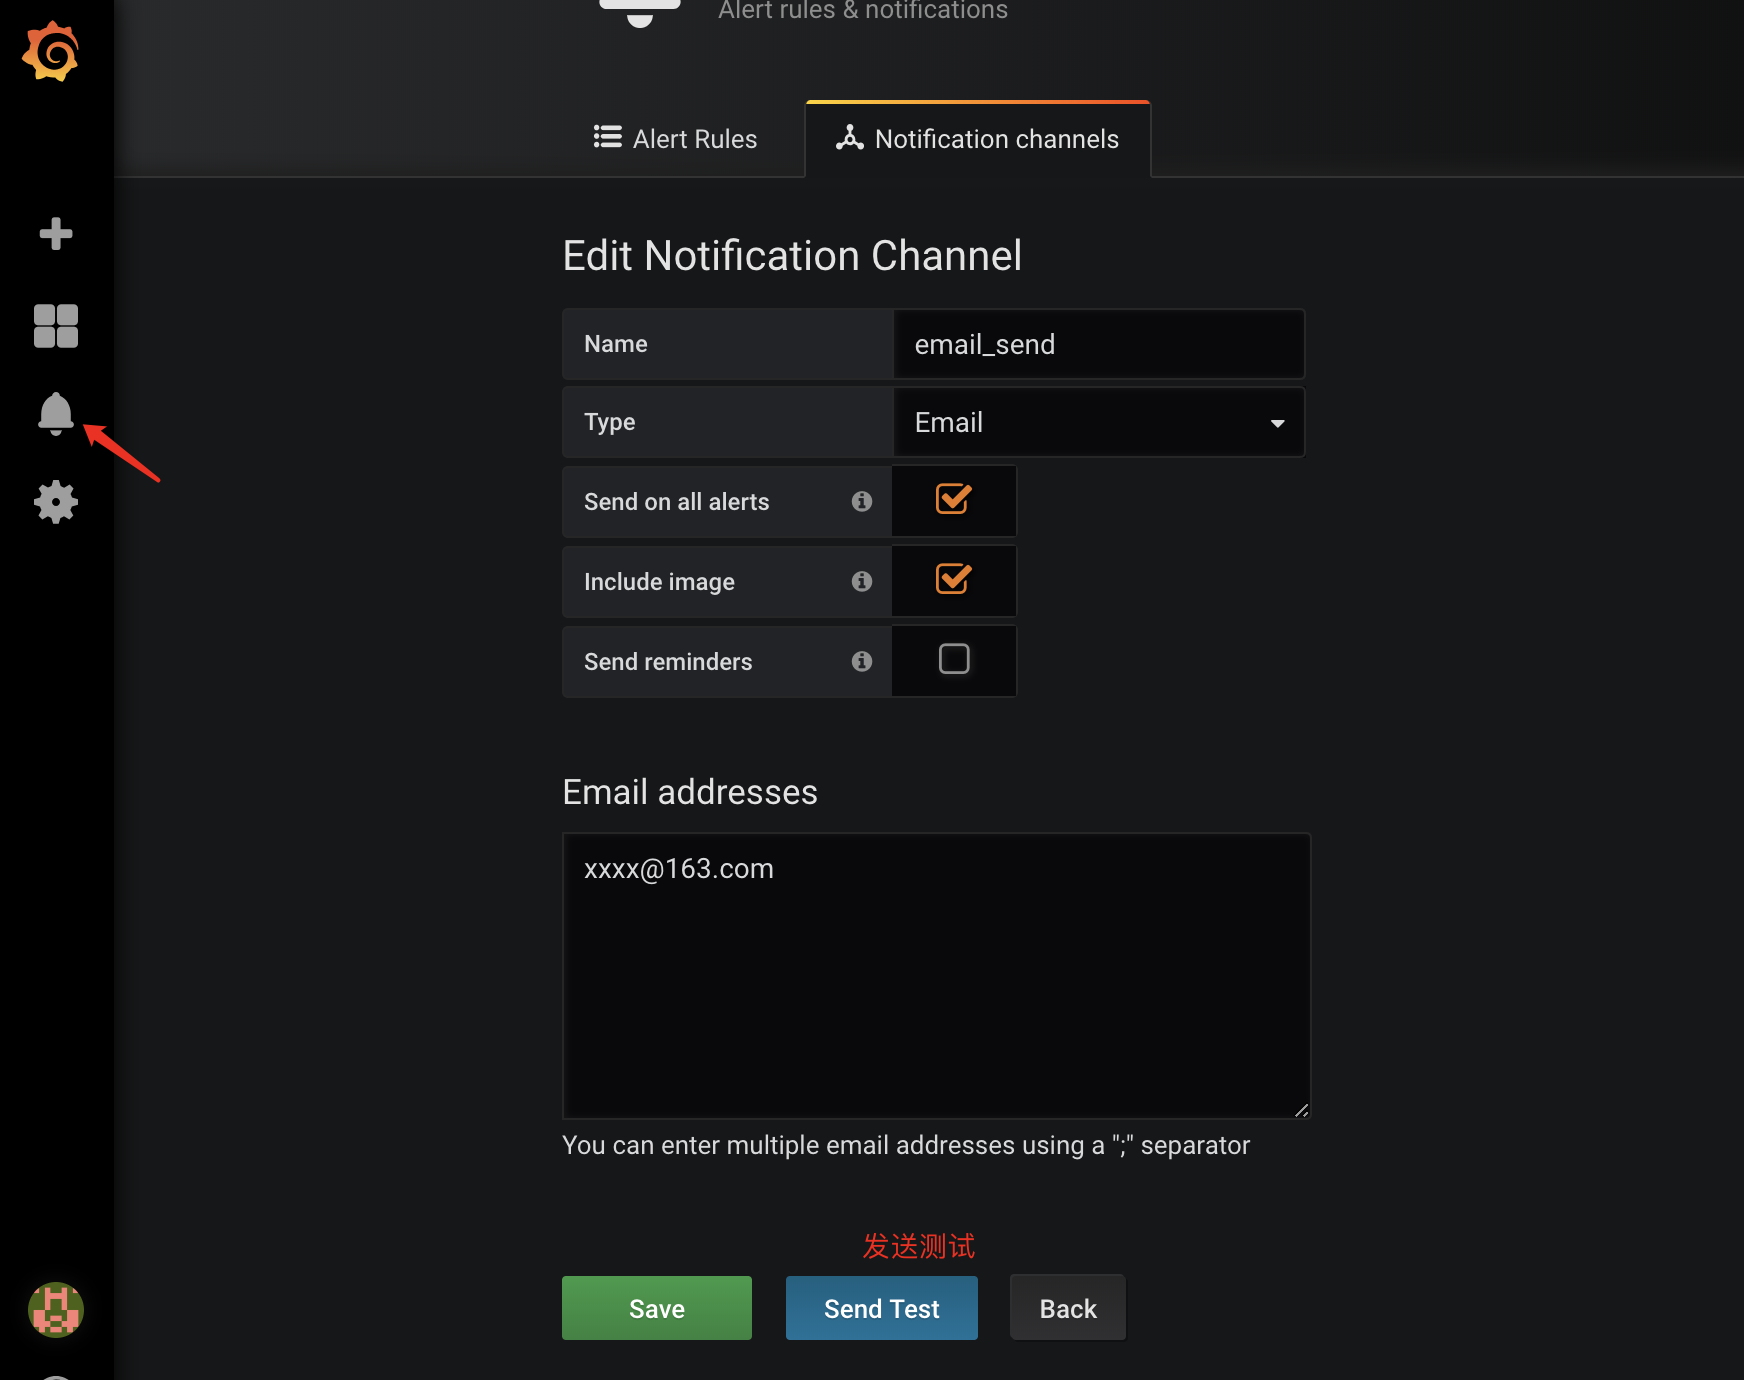
相关配置我们可以参考:地址,当我们启动成功以后,我们可以参考如下界面进行配置:
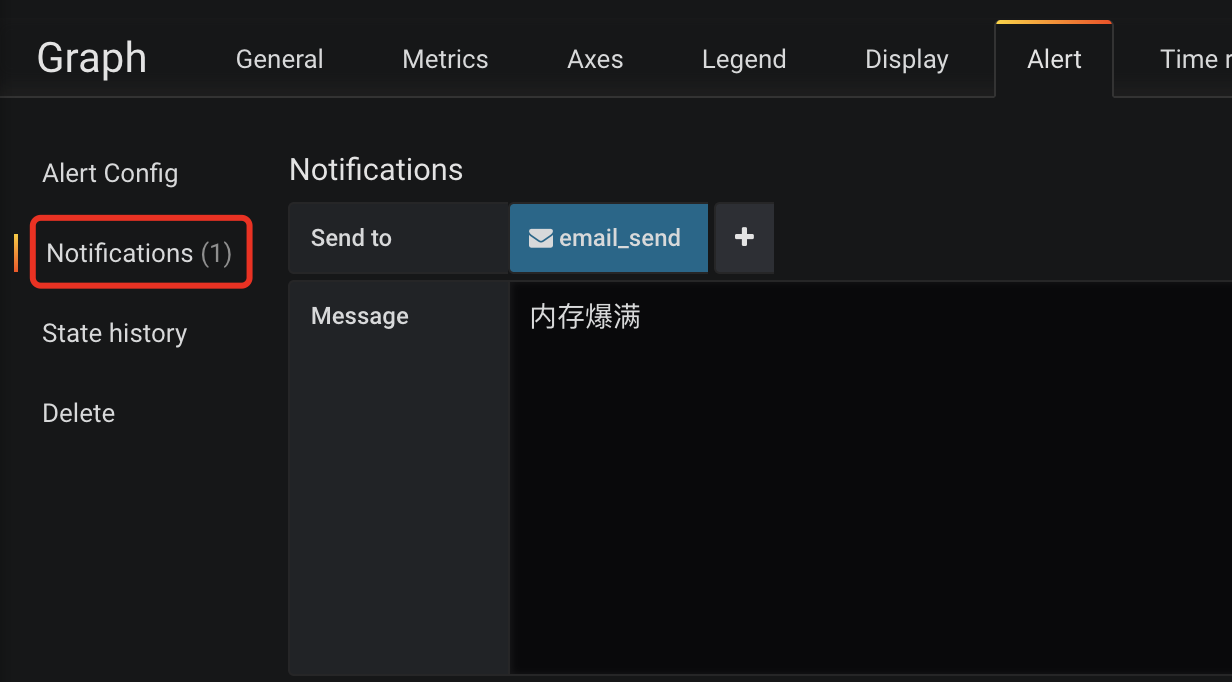
收到测试邮件后,我们需要设置监控值,在这里我以内存监控举例:

同时我们需要配置发送邮件具体内容:
最后我们保存我们设置的Dashboard即可,另外我们在metrics选项卡里配置的表达式切记不可使用表达式,否则会报上述错误Template Variables are not supported in alert queries的错误
基于Docker+Prometheus+Grafana监控SpringBoot健康信息的更多相关文章
- 【Springboot】用Prometheus+Grafana监控Springboot应用
1 简介 项目越做越发觉得,任何一个系统上线,运维监控都太重要了.关于Springboot微服务的监控,之前写过[Springboot]用Springboot Admin监控你的微服务应用,这个方案可 ...
- Prometheus+Grafana监控SpringBoot
Prometheus+Grafana监控SpringBoot 一.Prometheus监控SpringBoot 1.1 pom.xml添加依赖 1.2 修改application.yml配置文件 1. ...
- Prometheus + Grafana 监控SpringBoot应用
一.用到的工具 Prometheus Grafana Micrometer Grafana Dashboard (4701) 二.安装和运行Prometheus 官网下载prometheus- ...
- Docker搭建Prometheus+grafana监控系统
一.Prometheus简介 1.简介 Prometheus是由SoundCloud开发的开源监控报警系统和时序列数据库(TSDB). Prometheus使用Go语言开发,是Google BorgM ...
- cAdvisor+Prometheus+Grafana监控docker
cAdvisor+Prometheus+Grafana监控docker 一.cAdvisor(需要监控的主机都要安装) 官方地址:https://github.com/google/cadvisor ...
- Prometheus + Grafana 监控系统搭
本文主要介绍基于Prometheus + Grafana 监控Linux服务器. 一.Prometheus 概述(略) 与其他监控系统对比 1 Prometheus vs. Zabbix Zabbix ...
- 部署Prometheus+Grafana监控
Prometheus 1.不是很友好,各种配置都手写 2.对docker和k8s监控有成熟解决方案 Prometheus(普罗米修斯) 是一个最初在SoudCloud上构建的监控系统,开源项目,拥有非 ...
- [转帖]Prometheus+Grafana监控Kubernetes
原博客的位置: https://blog.csdn.net/shenhonglei1234/article/details/80503353 感谢原作者 这里记录一下自己试验过程中遇到的问题: . 自 ...
- Prometheus+Grafana监控Kubernetes
涉及文件下载地址:链接:https://pan.baidu.com/s/18XHK7ex_J0rzTtfW-QA2eA 密码:0qn6 文件中需要下载的镜像需要自己提前下载好,eg:prom/node ...
随机推荐
- 微信小程序之 -----事件
事件分类 1. 冒泡事件: 当一个组件上的事件被触发后,该事件会向父节点传递. 2. 非冒泡事件: 当一个组件上的事件被触发后,该事件不会向父节点传递. 常见的冒泡 ...
- 20175234 2018-2019-2 《Java程序设计》第四周学习总结
20175234 2018-2019-2 <Java程序设计>第四周学习总结 教材学习内容总结 教材学习了子类,其重点是方法重写.对象的上转型对象和多态,强调了面向抽象编程的思想. 学习I ...
- gdb调试技巧 找到php执行进程当前执行的代码
假设线上有一段php脚本,突然在某天出问题了,不处理但是进程没有退出.这种情况可能是异常休眠或者是有段死循环代码,但是我们怎么定位呢,我们这个时候最想知道的应该是这个脚本在此刻在做什么吧.这个是gdb ...
- QT-QWebEngineView-createWindow弹出页面解决
首先要写一个继承QWebEngineView的类 头文件: #ifndef WEBBROWSER_H #define WEBBROWSER_H #include <QWebEngineView& ...
- AX_UserInfo
UserInfoHelp::userInUserGroup(curuserid(), "Admin") EmplTable::userId2EmplId(curuserid()) ...
- ----关于posotion的sticky与fixed的区别----
sticky 出现在正常流当中,不能设置定位,随页面滚动 (sticky = relative + fixed) fixed 不出现在正常流当中,能设置定位,随页面滚动 eg: html: <p ...
- mySQL配置文件、备份与恢复
mysql配置文件 mysql的配置文件为/etc/my.cnf 配置文件查找次序:若在多个配置文件中均有设定,则最后找到的最终生效 /etc/my.cnf --> /etc/mysql/my. ...
- PHP-预定义函数访问数据库
(1)复习:自定义函数 (2)调用PHP预定义的函数——访问MySQL数据库 1.函数的基础概念 定义一个简单的函数: function 函数名( ){ #函数主体 } 调用/运行一次函数: ...
- django的简单原理
一.自定义客户端和服务端的请求响应 1.客户端打开url,向服务器发出请求 2.服务端用socket写一个py,用于接收请求和做出响应 3.服务端接收请求 4.服务端模拟HTTP协议做出响应,状态行为 ...
- 杭州某知名xxxx公司急招大量java以及大数据开发工程师
因公司战略以及业务拓展,收大量java攻城狮以及大数据开发攻城狮. 职位信息: java攻城狮: https://job.cnblogs.com/offer/56032 大数据开发攻城狮: https ...