LiveCharts文档-3开始-8自定义工具提示
LiveCharts文档-3开始-8自定义工具提示
默认每个需要tooltip或者legend的chart都会初始化一个DefaultLengend和DefaultTooltip对象。
自定义默认
你可以用下面的类来自定义一小部分,比如背景颜色,指示块尺寸方向。
cartesianChart1.Datatooltip.Bulletize = 20;

cartesianChart1.DataTooltip.Background = Brushes.Red;
你也可以设置你的tooltip的选择模式,比如,用下面的代码我们可以强制让tooltip只在鼠标悬停的时候显示。
cartesianChart1.DataTooltip.SelectionMode = LiveCharts.TooltipSelectionMode.OnlySender;从头开始
当你需要自定义图表控件外观的时候,直接使用前面的代码就可以了,但是怎么来修改提示中的数据显示方式呢,或者在工具提示中显示额外的属性呢?
很可惜,在WinForms中没有原生的方式来显示,但鉴于LiveCharts.Winforms其实是LiveCharts.Wpf的包装器,你必须自定义一个Wpf控件来使它起作用,很简单,你不需要知道太多wpf的东西就可以让它工作。
DefaultTooltip和DefaultLengen类对所有例子都适用,如果你需要一个特定的控件,你可以很容易的自定义一个,当你创建一个自定义用户控件的时候,LiveCharts能够将用户需要的数据显示在tooltip当中,你需要根据你的需要来处理数据如何显示,如果你懂wpf,那么你可以做任何设定。
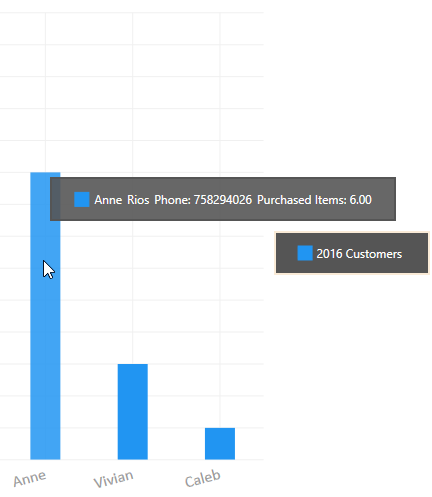
下一个例子,我们将配置图表来绘制CustomeVm类,我们将创建一个自定义的tooltip来显示更多的客户属性。
右击解决方案管理器,添加一个类,如下:
namespace Wpf.CartesianChart.CustomTooltipAndLegend

{

    public class CustomerVm

    {

        public string Name { get; set; }

        public string LastName { get; set; }

        public int Phone { get; set; }

        public int PurchasedItems { get; set; }

    }

}现在我们就要构造自己的数据工具提示,工具提示会显示所有CustomVm属性,右键添加新的WPF用户控件,命名它为CustomerTooltip,内容如下:
<UserControl x:Class="Wpf.CartesianChart.CustomTooltipAndLegend.CustomersTooltip"

             xmlns="http://schemas.microsoft.com/winfx/2006/xaml/presentation"

             xmlns:x="http://schemas.microsoft.com/winfx/2006/xaml"

             xmlns:mc="http://schemas.openxmlformats.org/markup-compatibility/2006"

             xmlns:d="http://schemas.microsoft.com/expression/blend/2008"

             xmlns:wpf="clr-namespace:LiveCharts.Wpf;assembly=LiveCharts.Wpf"

             xmlns:local="clr-namespace:Wpf.CartesianChart.CustomTooltipAndLegend"

             mc:Ignorable="d"

             d:DesignHeight="300" d:DesignWidth="300"

             d:DataContext="{d:DesignInstance local:CustomersTooltip}"

             Background="#E4555555" Padding="20 10" BorderThickness="2" BorderBrush="#555555">

    <ItemsControl ItemsSource="{Binding Data.Points}" Grid.IsSharedSizeScope="True">

        <ItemsControl.ItemTemplate>

            <DataTemplate DataType="{x:Type wpf:DataPointViewModel}">

                <Grid Margin="2">

                    <Grid.ColumnDefinitions>

                        <ColumnDefinition Width="Auto"/>

                        <ColumnDefinition Width="Auto" SharedSizeGroup="Title"/>

                        <ColumnDefinition Width="Auto" SharedSizeGroup="LastName"/>

                        <ColumnDefinition Width="Auto" SharedSizeGroup="Phone"/>

                        <ColumnDefinition Width="Auto" SharedSizeGroup="PurchasedItems"/>

                    </Grid.ColumnDefinitions>

                    <Rectangle Grid.Column="0" Stroke="{Binding Series.Stroke}" Fill="{Binding Series.Fill}"

                               Height="15" Width="15"></Rectangle>

                    <TextBlock Grid.Column="1" Text="{Binding ChartPoint.Instance.(local:CustomerVm.Name)}"

                               Margin="5 0 0 0" VerticalAlignment="Center" Foreground="White"/>

                    <TextBlock Grid.Column="2" Text="{Binding ChartPoint.Instance.(local:CustomerVm.LastName)}"

                               Margin="5 0 0 0" VerticalAlignment="Center" Foreground="White"/>

                    <TextBlock Grid.Column="3" Text="{Binding ChartPoint.Instance.(local:CustomerVm.Phone),

                                                        StringFormat=Phone: {0}}"

                               Margin="5 0 0 0" VerticalAlignment="Center" Foreground="White"/>

                    <TextBlock Grid.Column="4" Text="{Binding ChartPoint.Instance.(local:CustomerVm.PurchasedItems),

                                                                StringFormat=Purchased Items: {0:N}}"

                               Margin="5 0 0 0" VerticalAlignment="Center" Foreground="White"/>

                </Grid>

            </DataTemplate>

        </ItemsControl.ItemTemplate>

    </ItemsControl>

</UserControl>
后台代码如下:
using System.ComponentModel;

using LiveCharts;

using LiveCharts.Wpf;

namespace Wpf.CartesianChart.CustomTooltipAndLegend

{

    public partial class CustomersTooltip : IChartTooltip

    {

        private TooltipData _data;

        public CustomersTooltip()

        {

            InitializeComponent();

            //LiveCharts will inject the tooltip data in the Data property

            //your job is only to display this data as required

            DataContext = this;

        }

        public event PropertyChangedEventHandler PropertyChanged;

        public TooltipData Data

        {

            get { return _data; }

            set

            {

                _data = value;

                OnPropertyChanged("Data");

            }

        }

        public TooltipSelectionMode? SelectionMode { get; set; }

        protected virtual void OnPropertyChanged(string propertyName = null)

        {

            if (PropertyChanged != null)

                PropertyChanged.Invoke(this, new PropertyChangedEventArgs(propertyName));

        }

    }

}最重要的是,自定义的CustomersTooltip实现了IChartTooltip接口,这个接口需要我们的用户控件实现INotifyPropertyChanged以及一个新的属性数据类型TooltipData,
LiveCharts将会注入所有它知道的当前点并显示在tooltip中,你的任务就是显示你需要的数据。
注意到我们在用户控件中使用了一个DataContext属性,并绑定Data.Points属性到我们的项目控件中来显示当前我们需要的点。添加一个自定义用户控件,命名为CustomersLegend,道理是一样的,你需要实现IChartLegend接口来处理被Livecharts注入的数据。
我们再来创建一个自定义的Legend,用自定义样式,
<UserControl x:Class="Wpf.CartesianChart.CustomTooltipAndLegend.CustomersLegend"

             xmlns="http://schemas.microsoft.com/winfx/2006/xaml/presentation"

             xmlns:x="http://schemas.microsoft.com/winfx/2006/xaml"

             xmlns:mc="http://schemas.openxmlformats.org/markup-compatibility/2006"

             xmlns:d="http://schemas.microsoft.com/expression/blend/2008"

             xmlns:local="clr-namespace:Wpf.CartesianChart.CustomTooltipAndLegend"

             xmlns:lvc="clr-namespace:LiveCharts.Wpf;assembly=LiveCharts.Wpf"

             mc:Ignorable="d"

             Background="#555555" BorderThickness="2" Padding="20 10" BorderBrush="AntiqueWhite"

             d:DataContext="{d:DesignInstance local:CustomersLegend}">

    <ItemsControl ItemsSource="{Binding Series}" Grid.IsSharedSizeScope="True">

        <ItemsControl.ItemTemplate>

            <DataTemplate DataType="{x:Type lvc:SeriesViewModel}">

                <Grid Margin="2">

                    <Grid.ColumnDefinitions>

                        <ColumnDefinition Width="Auto"/>

                        <ColumnDefinition Width="Auto" SharedSizeGroup="Title"/>

                    </Grid.ColumnDefinitions>

                    <Rectangle Grid.Column="0" Stroke="{Binding Stroke}" Fill="{Binding Fill}"

                               Width="15" Height="15"/>

                    <TextBlock Grid.Column="1" Margin="4 0" Text="{Binding Title}" Foreground="White" VerticalAlignment="Center" />

                </Grid>

            </DataTemplate>

        </ItemsControl.ItemTemplate>

    </ItemsControl>

</UserControl>
using System.Collections.Generic;
using System.ComponentModel;
using System.Windows.Controls;
using LiveCharts.Wpf;
namespace Wpf.CartesianChart.CustomTooltipAndLegend
{
public partial class CustomersLegend : UserControl, IChartLegend
{
private List<SeriesViewModel> _series;
public CustomersLegend()
{
InitializeComponent();
DataContext = this;
}
public List<SeriesViewModel> Series
{
get { return _series; }
set
{
_series = value;
OnPropertyChanged("Series");
}
}
public event PropertyChangedEventHandler PropertyChanged;
protected virtual void OnPropertyChanged(string propertyName = null)
{
if (PropertyChanged != null)
PropertyChanged.Invoke(this, new PropertyChangedEventArgs(propertyName));
}
}
}最后把自定的控件设定到我们的图表上就可以了。
cartesianChart1.ChartLegend = new CustomersLegend();

cartesianChart1.DataTooltip = new CustomersTooltip();
LiveCharts文档-3开始-8自定义工具提示的更多相关文章
- LiveCharts文档-3开始-7标签
原文:LiveCharts文档-3开始-7标签 LiveCharts文档-3开始-7标签 Label就是Chart中表示数值的字符串,通常被放置在轴的位置和提示当中. 下图中的这些字符串显示的都是标签 ...
- LiveCharts文档-3开始-6轴Axes
原文:LiveCharts文档-3开始-6轴Axes LiveCharts文档-3开始-6轴Axes 通常来说,你可以自定义LiveChart里的任何东西,Axes也不例外.下面这幅图展示了Axes. ...
- LiveCharts文档-3开始-4可用的图表
原文:LiveCharts文档-3开始-4可用的图表 LiveCharts文档-3开始-4可用的图表 LiveCharts共有5类图表,你将会在后面的章节当中看到这些图表的使用方法. Cartesia ...
- LiveCharts文档-3开始-2基础
原文:LiveCharts文档-3开始-2基础 LiveCharts文档-3开始-2基础 基本使用 LiveCharts设计的很容易使用,所有的东西都可以自动的实现更新和动画,库会在它觉得有必要更新的 ...
- LiveCharts文档-3开始-3类型和设置
原文:LiveCharts文档-3开始-3类型和设置 LiveCharts文档-3开始-3类型和设置 类型和设置 这一部分非常的重要,涉及到LiveCharts的基本构成单元的介绍 LiveChart ...
- LiveCharts文档-4基本绘图-3其他
原文:LiveCharts文档-4基本绘图-3其他 4基本绘图-3其他 因为每个图表的使用方法大同小异,所以不再啰嗦重复,具体直接看这个链接里的介绍.原文链接 其他的图表类型有 基本堆叠图 基本条形图 ...
- LiveCharts文档-4基本绘图-1基本线条图
原文:LiveCharts文档-4基本绘图-1基本线条图 4基本绘图-1基本线条图 using System; using System.Windows.Forms; using System.Win ...
- LiveCharts文档-4基本绘图-2基本柱形图
原文:LiveCharts文档-4基本绘图-2基本柱形图 4基本绘图-2基本柱形图 using System.Windows.Forms; using LiveCharts; using LiveCh ...
- LiveCharts文档-3开始-5序列Series
原文:LiveCharts文档-3开始-5序列Series LiveCharts文档-3开始-5序列Series Strokes和Fills 笔触和填充 所有的Series都有笔触和填充属来处理颜色, ...
随机推荐
- Django基础篇--模板和路由分发
Django模板 首先什么是一个模板? 简单来说就是一个网页,可以被view响应给用户 目的是为了解决复杂的显示问题 2. 模板的设置问题 setting.py中的TEMPLATES配置 1)BACK ...
- Ubuntu18.04 安装mysql8.0.11
1.下载deb包 2.运行命令 sudo dpkg -i mysql-apt-config_0.8.10-1_all.deb sudo apt update 3.安装mysql8 sudo apt i ...
- 【Java入门提高篇】Day22 Java容器类详解(五)HashMap源码分析(上)
准备了很长时间,终于理清了思路,鼓起勇气,开始介绍本篇的主角——HashMap.说实话,这家伙能说的内容太多了,要是像前面ArrayList那样翻译一下源码,稍微说说重点,肯定会让很多人摸不着头脑,不 ...
- Info.plist的CFBundleIdentifier、CFBundleName、BundleDisplayName
plist关键字段: CFBundleIdentifier:应用包名.唯一标识 CFBundleVersion:文件版本号,可以每次发版本递增 CFBundleShortVersionString:a ...
- chrome新版打开新标签页自动打开谷歌主页
最近更新了chrome,发现新版有个问题. 打开标签页时会自动跳转至 https://www.google.com/webhp?ie=UTF-8&gws_rd=cr&rct=j 导致我 ...
- python第二十二天-----在做作业当中............
作业 1, ATM:模拟实现一个ATM + 购物商城程序 额度 自定义实现购物商城,买东西加入 购物车,调用信用卡接口结账可以提现,手续费5%支持多账户登录支持账户间转账记录每月日常消费流水提供还款接 ...
- alsa声卡分析alsa-utils调用过程(二)-tinymixer
继上一篇文章:http://www.cnblogs.com/linhaostudy/p/8515277.html 三.tinymixer调用分析:(tinymixer.log搜索节点:/dev/snd ...
- 鸟哥的 Linux 私房菜Shell Scripts篇(二)
参考: http://linux.vbird.org/linux_basic/0340bashshell-scripts.php#script_be http://www.runoob.com/lin ...
- 修改css的(屏蔽)overflow: hidden;实现浏览器能把网页全图保存成图片
摘要: 1.项目需要,需要对网页内容“下载”保存成全图片 2.QQ浏览器等主流浏览器都支持这种下载保存功能 3.项目需要场景:编写好的项目维护文档,放在服务器上.如果是txt不能带图片可视化,如果wo ...
- SQL易错总结1
SQL易错总结1 进阶 select语句.select * 查询所有不规范,写出要查的属性.distinct慎用,性能消耗很大 like 模糊查询 ,空值判断是 is null 单行函数:lower( ...