python之histogram
histogram
A histogram is an accurate representation of the distribution of numerical data. It is an estimate of the probability distribution of a continuous variable (quantitative variable) and was first introduced by Karl Pearson.To construct a histogram, the first step is to "bin" (or "bucket") the range of values—that is, divide the entire range of values into a series of intervals—and then count how many values fall into each interval. The bins are usually specified as consecutive, non-overlapping intervals of a variable. The bins (intervals) must be adjacent, and are often (but are not required to be) of equal size.
matplotlib.pyplot.hist
matplotlib.pyplot.hist(x, bins=None, range=None, density=None, weights=None, cumulative=False, bottom=None, histtype='bar', align='mid', orientation='vertical', rwidth=None, log=False, color=None, label=None, stacked=False, normed=None, hold=None, data=None, ***kwargs*)
Plot a histogram.
Compute and draw the histogram of x. The return value is a tuple (n, bins, patches) or ([n0, n1, …], bins, [patches0, patches1,…]) if the input contains multiple data.
Multiple data can be provided via x as a list of datasets of potentially different length ([x0, x1, …]), or as a 2-D ndarray in which each column is a dataset. Note that the ndarray form is transposed relative to the list form.
Masked arrays are not supported at present.
parameters
x : (n,) array or sequence of (n,) arrays
Input values, this takes either a single array or a sequence of arrays which are not required to be of the same length.
bins : integer or sequence or ‘auto’, optional
bins 即是 根据x中的数据集 划分 合适的组数。一般可以先用'auto',然后在此基础上对bins进行微调。
If an integer is given, bins + 1 bin edges are calculated and returned, consistent with numpy.histogram().
If bins is a sequence, gives bin edges, including left edge of first bin and right edge of last bin. In this case, bins is returned unmodified.
All but the last (righthand-most) bin is half-open. In other words, if bins is:
[1, 2, 3, 4]
then the first bin is [1, 2) (including 1, but excluding 2) and the second [2, 3). The last bin, however, is [3, 4], which includes 4.
Unequally spaced bins are supported if bins is a sequence.
If Numpy 1.11 is installed, may also be 'auto'.
Default is taken from the rcParam hist.bins.
density : boolean, optional
If True, the first element of the return tuple will be the counts normalized to form a probability density, i.e., the area (or integral) under the histogram will sum to 1. This is achieved by dividing the count by the number of observations times the bin width and not dividing by the total number of observations. If stacked is also True, the sum of the histograms is normalized to 1.
Default is None for both normed and density. If either is set, then that value will be used. If neither are set, then the args will be treated as False.
If both density and normed are set an error is raised.
returns
n : array or list of arrays
The values of the histogram bins. See normed or density and weights for a description of the possible semantics. If input x is an array, then this is an array of length nbins. If input is a sequence arrays [data1, data2,..], then this is a list of arrays with the values of the histograms for each of the arrays in the same order.
默认,n 返回 落在每个区间里的数 的频数 的list;若指定density = True,n 返回 每个区间的概率密度值的列表
bins : array
The edges of the bins. Length nbins + 1 (nbins left edges and right edge of last bin). Always a single array even when multiple data sets are passed in.
patches : list or list of lists
Silent list of individual patches used to create the histogram or list of such list if multiple input datasets.
例子
ex1
#!/usr/bin/env python3

#-*- coding:utf-8 -*-

############################

#File Name: hist.py

#Brief:

#Author: frank

#Mail: frank0903@aliyun.com

#Created Time:2018-06-13 22:03:35

############################

import matplotlib.pyplot as plt

import numpy as np

a = [34, 40, 37, 30, 44, 36, 32, 26, 32, 36]

n,bins,patches = plt.hist(a,bins='auto')

print("n:{}, bins:{},pathes:{}".format(n,bins,patches))

plt.show()
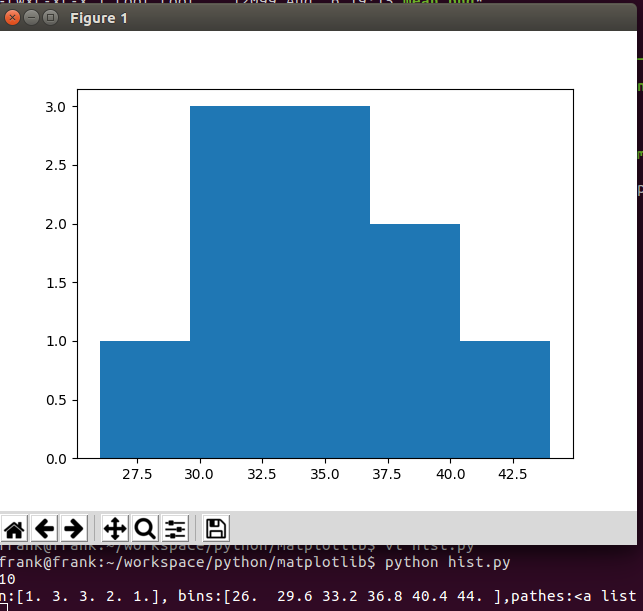
从上例可知,bins 区间的个数为5个,即
[26,29.6], 落在 [26,29.6] 里的数是26, 频数是1
[29.6,33.2],落在[29.6,33.2]里的数是 30,32,32,频数是3
[33.2,36.8],落在[33.2,36.8]里的数是 34,36,36,频数是3
[36.8,40.4],落在[36.8,40.4]里的数是 37,40,频数是2
[40.4,44],落在[40.4,44]里的数是44,频数是1
ex2
看density参数对直方图的影响
#!/usr/bin/env python3

#-*- coding:utf-8 -*-

############################

#File Name: hist.py

#Brief:

#Author: frank

#Mail: frank0903@aliyun.com

#Created Time:2018-06-13 22:03:35

############################

import matplotlib.pyplot as plt

import numpy as np

a = [34, 40, 37, 30, 44, 36, 32, 26, 32, 36]

n,bins,patches = plt.hist(a,bins='auto',density=True)

print("n:{}, bins:{},pathes:{}".format(n,bins,patches))

plt.show()
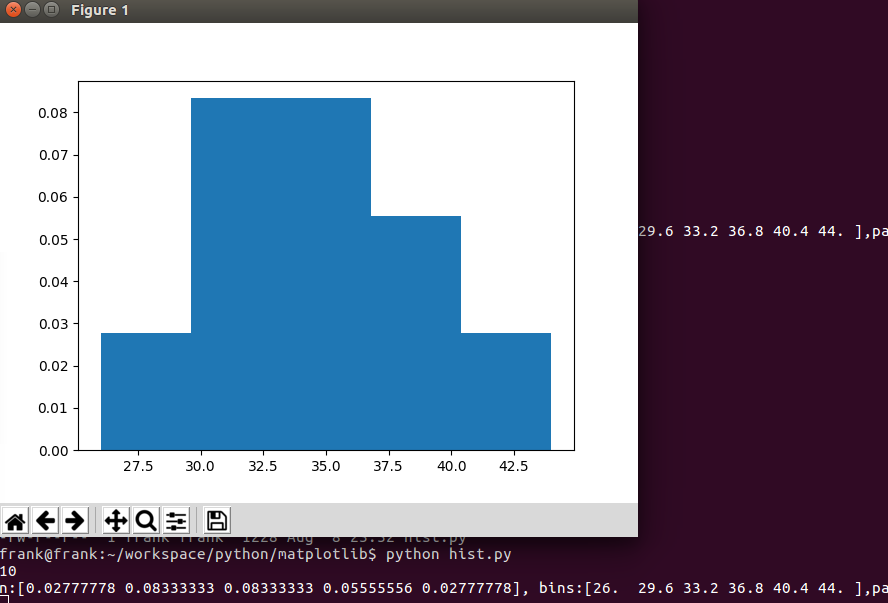
从上例可知,当density为True时,直方图的y轴表示的是概率密度值。
\(\text{the bin width}=\frac {max-min}{bins}=\frac{44-26}{5}=3.6\)
[26,29.6], 落在 [26,29.6] 里的数是26, 频数是1,\(\frac {频数}{\text{the number of observations} \cdot \text{the bin width}}=\frac {1}{10\cdot 3.6}=0.02777778\)
其他区间的类似
python之histogram的更多相关文章
- Prometheus学习系列(三)之Prometheus 概念:数据模型、metric类型、任务、实例
前言 本文来自Prometheus官网手册1.Prometheus官网手册2 和 Prometheus简介 说明 Prometheus从根本上存储的所有数据都是时间序列: 具有时间戳的数据流只属于单个 ...
- 灰度图的直方图均衡化(Histogram Equalization)原理与 Python 实现
原理 直方图均衡化是一种通过使用图像直方图,调整对比度的图像处理方法:通过对图像的强度(intensity)进行某种非线性变换,使得变换后的图像直方图为近似均匀分布,从而,达到提高图像对比度和增强图片 ...
- python绘制图的度分布柱状图, draw graph degree histogram with Python
图的度数分布 import collections import matplotlib.pyplot as plt import networkx as nx G = nx.gnp_random_gr ...
- [LeetCode]题解(python):084-Largest Rectangle in Histogram
题目来源: https://leetcode.com/problems/largest-rectangle-in-histogram/ 题意分析: 给定一个数组,数组的数字代表这个位置上的bar的高度 ...
- [leetcode]Largest Rectangle in Histogram @ Python
原题地址:https://oj.leetcode.com/problems/largest-rectangle-in-histogram/ 题意: Given n non-negative integ ...
- opencv python:图像直方图 histogram
直接用matplotlib画出直方图 def plot_demo(image): plt.hist(image.ravel(), 256, [0, 256]) # image.ravel()将图像展开 ...
- 【LeetCode】84. Largest Rectangle in Histogram 柱状图中最大的矩形(Python)
作者: 负雪明烛 id: fuxuemingzhu 个人博客: http://fuxuemingzhu.cn/ 目录 题目描述 题目大意 解题方法 单调栈 日期 题目地址: https://leetc ...
- 1 python大数据挖掘系列之基础知识入门
preface Python在大数据行业非常火爆近两年,as a pythonic,所以也得涉足下大数据分析,下面就聊聊它们. Python数据分析与挖掘技术概述 所谓数据分析,即对已知的数据进行分析 ...
- Python绘图
1.二维绘图 a. 一维数据集 用 Numpy ndarray 作为数据传入 ply 1. import numpy as np import matplotlib as mpl import mat ...
随机推荐
- Ubuntu下,清屏等终端常用命令
转自:http://blog.csdn.net/gaojinshan/article/details/9314435 # ctrl + l - 清屏 . cLear# ctrl + c - 终止命令. ...
- Delphi XE8 TStyleBook的使用
Delphi XE8来了,FMX的性能有了巨大的提升,比如:XE7下ListBox上下滑动的卡顿已经不复存在,直接用xe8编译后,再上下划动ListBox,已经变的非常流畅.另外,也见到有网友说,通过 ...
- Make Menuconfig详解 (配置内核选择)
Make Menuconfig简介 make menuconfig 图形化的内核配置make mrproper -----删除不必要的文件和目录. #make config(基于文本的最为传统的配置界 ...
- Codeforces 570D TREE REQUESTS dfs序+树状数组 异或
http://codeforces.com/problemset/problem/570/D Tree Requests time limit per test 2 seconds memory li ...
- 使用RMAN和控制文件备份删除归档日志的SHELL脚本--RED HAT 5 LINUX 64
在ORACLE用户下的定时器设置 [oracle@SHARKDB dbscripts]$ crontab -l# minute hour day month week15 1 * * 0 sh / ...
- .net framework中重新注册IIS
要为 ASP.NET 修复 IIS 映射,请按照下列步骤执行操作:运行 Aspnet_regiis.exe 实用工具:单击“开始”,然后单击“运行”.在“打开”文本框中,键入 cmd,然后按 ENTE ...
- IM开发基础知识补课(四):正确理解HTTP短连接中的Cookie、Session和Token
本文引用了简书作者“骑小猪看流星”技术文章“Cookie.Session.Token那点事儿”的部分内容,感谢原作者. 1.前言 众所周之,IM是个典型的快速数据流交换系统,当今主流IM系统(尤其移动 ...
- UITableView Scroll to top 手动设置tableview 滚动到 顶部
UITableView Scroll to top 手动设置tableview 滚动到 顶部 [mainTableView scrollRectToVisible:CGRectMake(0,0,1,1 ...
- 算法笔记_071:SPFA算法简单介绍(Java)
目录 1 问题描述 2 解决方案 2.1 具体编码 1 问题描述 何为spfa(Shortest Path Faster Algorithm)算法? spfa算法功能:给定一个加权连通图,选取一个 ...
- GOF设计模式之单例模式
定义 单例模式(Singleton Pattern)的定义如下:Ensure a class only has one instance, and provide a global point of ...