Hystrix-Dashboard仪表盘
Hystrix Dashboard,它主要用来实时监控Hystrix的各项指标信息。通过Hystrix Dashboard反馈的实时信息,可以帮助我们快速发现系统中存在的问题。下面通过一个例子来学习。
一、新建一个Spring Cloud 项目,命名为hystrix-dashboard
1.1在pom.xml引入相关的依赖
<dependency>

    <groupId>org.springframework.cloud</groupId>

    <artifactId>spring-cloud-starter-hystrix</artifactId>

</dependency>

<dependency>

    <groupId>org.springframework.cloud</groupId>

    <artifactId>spring-cloud-starter-hystrix-dashboard</artifactId>

</dependency>

<dependency>

    <groupId>org.springframework.boot</groupId>

    <artifactId>spring-boot-starter-actuator</artifactId>

</dependency>
1.2在spring boot 的启动类上面引入注解@EnableHystrixDashboard,启用Hystrix Dashboard功能。
package org.hope.hystrix.dashboard;

import org.springframework.boot.SpringApplication;

import org.springframework.cloud.client.SpringCloudApplication;

import org.springframework.cloud.netflix.hystrix.dashboard.EnableHystrixDashboard;

@EnableHystrixDashboard

@SpringCloudApplication

public class HystrixDashboardApplication {

    public static void main(String[] args) {

        SpringApplication.run(HystrixDashboardApplication.class, args);

    }

}
1.3修改配置文件application.properties
spring.application.name=hystrix-dashboard

server.port=2001
1.4启动应用,然后再浏览器中输入http://localhost:2001/hystrix可以看到如下界面
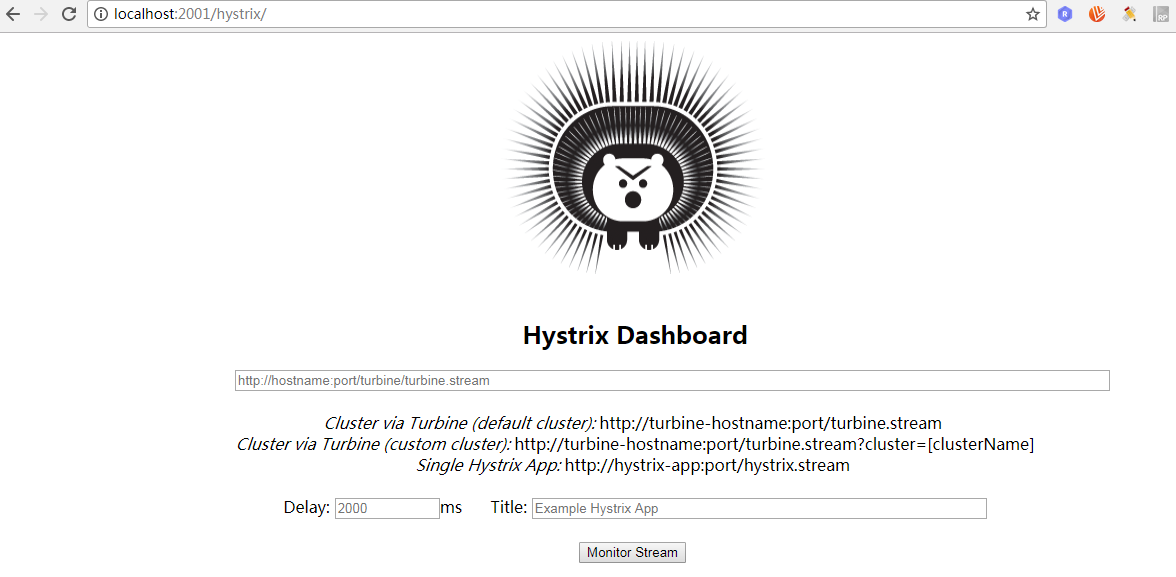
通过Hystrix Dashboard主页面的文字介绍,我们可以知道,Hystrix Dashboard共支持三种不同的监控方式
☞默认的集群监控:通过URL:http://turbine-hostname:port/turbine.stream开启,实现对默认集群的监控。
☞指定的集群监控:通过URL:http://turbine-hostname:port/turbine.stream?cluster=[clusterName]开启,实现对clusterName集群的监控。
☞单体应用的监控:通过URL:http://hystrix-app:port/hystrix.stream开启,实现对具体某个服务实例的监控。
☞Delay:控制服务器上轮询监控信息的延迟时间,默认为2000毫秒,可以通过配置该属性来降低客户端的网络和CPU消耗。
☞Title:该参数可以展示合适的标题。
二、要有一个eureka-server用来提供eureka的服务注册中心,在码云上有,可以作为参考。此处不再粘代码。
三、要有一个eureka-service来提供服务,工程名为hello-service,项目地址同上。
四、新建一个服务被监控的工程,工程名为ribbon-customer。
4.1pom.xml引入相关依赖
<dependency>

    <groupId>org.springframework.boot</groupId>

    <artifactId>spring-boot-starter-actuator</artifactId>

</dependency>

<dependency>

    <groupId>org.springframework.cloud</groupId>

    <artifactId>spring-cloud-starter-hystrix</artifactId>

</dependency>
4.2在启动类上添加@EnableCircuitBreaker 开启断路器功能
package com.didispace;

import org.springframework.boot.SpringApplication;

import org.springframework.boot.autoconfigure.SpringBootApplication;

import org.springframework.cloud.client.circuitbreaker.EnableCircuitBreaker;

import org.springframework.cloud.client.discovery.EnableDiscoveryClient;

import org.springframework.cloud.client.loadbalancer.LoadBalanced;

import org.springframework.context.annotation.Bean;

import org.springframework.web.client.RestTemplate;

@EnableCircuitBreaker //开启断路器功能

@EnableDiscoveryClient

@SpringBootApplication

public class ConsumerApplication {

    @Bean

    @LoadBalanced

    RestTemplate restTemplate() {

        return new RestTemplate();

    }

    public static void main(String[] args) {

        SpringApplication.run(ConsumerApplication.class, args);

    }

}
4.3 RestController
package com.didispace.web;

import org.springframework.beans.factory.annotation.Autowired;

import org.springframework.web.bind.annotation.RequestMapping;

import org.springframework.web.bind.annotation.RequestMethod;

import org.springframework.web.bind.annotation.RestController;

@RestController

public class ConsumerController {

    @Autowired

    HelloService helloService;

    @RequestMapping(value = "/ribbon-consumer", method = RequestMethod.GET)

    public String helloConsumer() {

        return helloService.hello();

    }

}
4.4 application.properties配置文件
spring.application.name=ribbon-consumer

server.port=9000

eureka.client.serviceUrl.defaultZone=http://localhost:1111/eureka/

hystrix.command.default.execution.isolation.thread.timeoutInMilliseconds=2000
通过上面的步骤,已经基本完成了准备工作,下面我们进行测试。
1.启动eureka-server
2.启动hello-service
3.启动ribbon-customer
4.启动hystrix-dashboard
5.在浏览器输入http://localhost:2001/hystrix
6.在浏览器的新窗口输入http://localhost:9000/ribbon-consumer
7.在Hystrix-Dashboard的主界面上输入: http://localhost:9000/hystrix.stream然后点击 Monitor Stream按钮
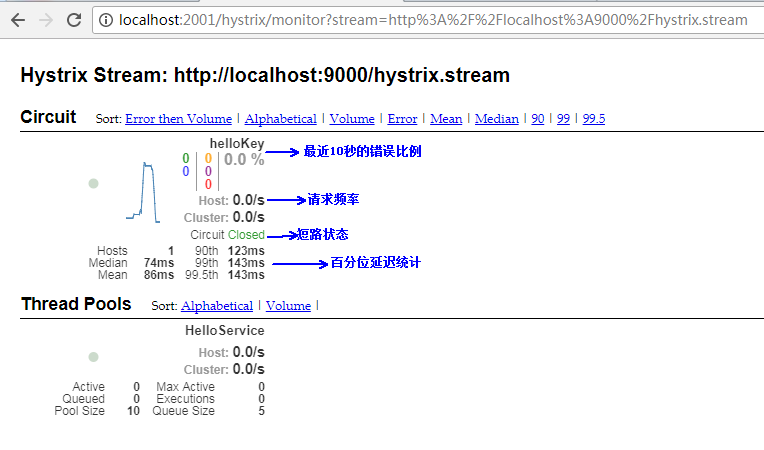
在监控的界面有两个重要的图形信息:一个实心圆和一条曲线。
▪实心圆:1、通过颜色的变化代表了实例的健康程度,健康程度从绿色、黄色、橙色、红色递减。2、通过大小表示请求流量发生变化,流量越大该实心圆就越大。所以可以在大量的实例中快速发现故障实例和高压实例。
▪曲线:用来记录2分钟内流浪的相对变化,可以通过它来观察流量的上升和下降趋势。
注意:当使用Hystrix Board来监控Spring Cloud Zuul构建的API网关时,Thread Pool信息会一直处于Loading状态。这是由于Zuul默认会使用信号量来实现隔离,只有通过Hystrix配置把隔离机制改成为线程池的方式才能够得以展示。
参考:
[1]《Spring Cloud微服务实战》,翟永超
[2]博客,纯洁的微笑,http://blog.csdn.net/ityouknow/article/details/72625646
Hystrix-Dashboard仪表盘的更多相关文章
- 【spring cloud】spring cloud2.X spring boot2.0.4调用feign配置Hystrix Dashboard 和 集成Turbine 【解决:Hystrix仪表盘Unable to connect to Command Metric Stream】【解决:Hystrix仪表盘Loading...】
环境: <java.version>1.8</java.version><spring-boot.version>2.0.4.RELEASE</spring- ...
- Spring Cloud第六篇 | Hystrix仪表盘监控Hystrix Dashboard
本文是Spring Cloud专栏的第六篇文章,了解前五篇文章内容有助于更好的理解本文: Spring Cloud第一篇 | Spring Cloud前言及其常用组件介绍概览 Spring Cloud ...
- hystrix dashboard Unable to connect to Command Metric Stream解决办法
spring cloud 在初次使用 hystrix dashboard仪表盘的时候很容易出现hystrix dashboard Unable to connect to Command Metric ...
- Spring Cloud 2-Hystrix DashBoard仪表盘(五)
Spring Cloud Hystrix DashBoard 1.监控系统配置 pom.xml application.yml Application.java 2.被监控服务配置 pom.xml ...
- Spring Cloud 入门教程(八): 断路器指标数据监控Hystrix Dashboard 和 Turbine
1. Hystrix Dashboard (断路器:hystrix 仪表盘) Hystrix一个很重要的功能是,可以通过HystrixCommand收集相关数据指标. Hystrix Dashboa ...
- 【六】Hystrix Dashboard
除了隔离依赖服务的调用以外,Hystrix还提供了准实时的调用监控(Hystrix Dashboard) , Hystrix会持续地记录所有通过 Hystrix发起的请求的执行信息,并以统计报表和图形 ...
- springcloud-知识点总结(三):Hystrix & Dashboard & turbine & Zuul & SpringCloud Config
1.Hystrix断路器简介 Hystrix断路器简介 hystrix对应的中文名字是“豪猪”,豪猪周身长满了刺,能保护自己不受天敌的伤害,代表了一种防御机制,这与hystrix本身的功能不谋而合,因 ...
- 服务容错保护断路器Hystrix之三:断路器监控(Hystrix Dashboard)-单体监控
turbine:英 [ˈtɜ:baɪn] 美 [ˈtɜ:rbaɪn] n.汽轮机;涡轮机;透平机 一.Hystrix Dashboard简介 在微服务架构中为了保证程序的可用性,防止程序出错导致网络阻 ...
- SpringCloud (十) Hystrix Dashboard单体监控、集群监控、与消息代理结合
一.前言 Dashboard又称为仪表盘,是用来监控项目的执行情况的,本文旨在Dashboard的使用 分别为单体监控.集群监控.与消息代理结合. 代码请戳我的github 二.快速入门 新建一个Sp ...
- springcloud系列九 整合Hystrix Dashboard
Hystrix Dashboard是Hystrix的仪表盘组件,主要用来实时监控Hystrix的各项指标信息,通过界面反馈的信息可以快速发现系统中存在的问题. 整合快速体验: pom.xml(这个是F ...
随机推荐
- C#Winform 自定义透明按钮和单窗体模块化实现
技术看点 WinForm自定义控件的使用 WinForm单窗体应用如何模块化 需求及效果 又来一波 C# GDI自定义控件show .这个控件已经使用几年了,最近找出来重构一下.原来是没有边框的,那么 ...
- Java框架之Mybatis(二)
本文主要介绍 Mybatis(一)之后剩下的内容: 1 mybatis 中 log4j的配置 2 dao层的开发(使用mapper代理的方式) 3 mybatis的配置详解 4 输入输出映射对应的类型 ...
- python 浅析类方法与静态方法
类方法,静态方法的定义 Python 是双面向的,既可以面向函数编程,也可以面向对象编程,所谓面向函数就是单独一个. py 文件,里面没有类,全是一些函数,调用的时候导入模块,通过模块名.函数名()即 ...
- Redis 部署主从哨兵 C#使用,实现自动获取redis缓存 实例2
资料查找https://www.cnblogs.com/tdws/p/5836122.html https://www.cnblogs.com/lori/p/5794454.html private ...
- Android4.0 声卡配置-高通msm8916移植
一个正常的UAC设备插入Android 7.0是默认打开UAC配置的,打印的log如下: [ - using xhci_hcd [ - [ -, Product=, SerialNumber= [ - ...
- python2与python3的区别 ,小数据池 bytes 类型
一.python2和3的区别 在python3中 在python2中 print('ab')方式打印内容()括号是必须要有的. print 'ab' 可以加可以不加. 只有range 有ran ...
- [翻译].NET Shell Extensions - Shell Context Menus---.net 外壳扩展-右键菜单
我自己的前言说明: 本文原作者为 Dave Kerr,原文链接为.NET Shell Extensions - Shell Context Menus:,我是在为了完成最新需求的时候查询资料的时 ...
- 1022: [SHOI2008]小约翰的游戏John【Nim博弈,新生必做的水题】
1022: [SHOI2008]小约翰的游戏John Time Limit: 1 Sec Memory Limit: 162 MBSubmit: 2709 Solved: 1726[Submit] ...
- [51nod1299]监狱逃离
到现在还是不会写系列,直接贴题解了. http://www.51nod.com/question/index.html#!questionId=1157 #include<cstdio> ...
- '<<' '|' '>>' 等位运算符 课本祥解
a<<1 相当于a*2 a>>1 相当于a/2 a<<|1 相当于a*2+1 一些算法用得到.