
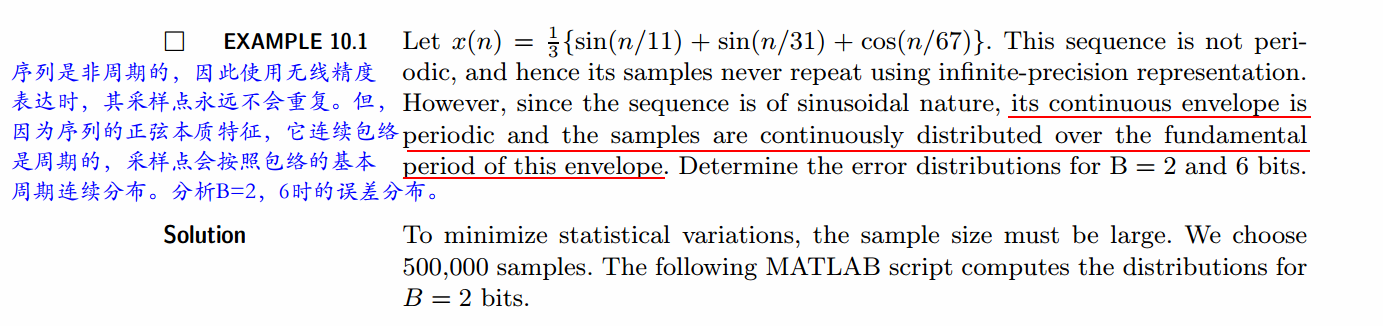
《DSP using MATLAB》示例 Example 10.1
坚持到第10章了,继续努力!
代码:
%% ------------------------------------------------------------------------

%%            Output Info about this m-file

fprintf('\n***********************************************************\n');

fprintf('        <DSP using MATLAB> Exameple 10.1 \n\n');

time_stamp = datestr(now, 31);

[wkd1, wkd2] = weekday(today, 'long');

fprintf('      Now is %20s, and it is %7s  \n\n', time_stamp, wkd2);

%% ------------------------------------------------------------------------

clear; close all;

% Example parameters

B = 2; N = 500000; n = [1:N];

xn = (1/3)*(sin(n/11) + sin(n/31) + cos(n/67)); clear n;

% Quantization error analysis

[H1, H2, Q, estat] = StatModelR(xn, B, N);          % Compute histograms

H1max = max(H1); H1min = min(H1);                   % Max and Min of H1

H2max = max(H2); H2min = min(H2);                   % Max and Min of H2

Hf1 = figure('units', 'inches', 'position', [1, 1, 8, 6], ...

	'paperunits', 'inches', 'paperposition', [0, 0, 6, 4], ...

	'NumberTitle', 'off', 'Name', 'Exameple 10.1a');

set(gcf,'Color','white');

TF = 10;

title('Normalized error e1 and e2');

subplot(2, 1, 1);

bar(Q, H1); axis([-0.5, 0.5, -0.001, 4/128]); grid on;

xlabel('Normalized error e1'); ylabel('Distribution of e1 ', 'vertical', 'baseline');

set(gca, 'YTickMode', 'manual', 'YTick', [0, [1:1:4]/128] );

text(-0.45, 0.030, sprintf('SAMPLE SIZE N = %d', N));

text(-0.45, 0.025, sprintf(' ROUNDED TO B = %d BITS', B));

text(-0.45, 0.020, sprintf('                   MEAN  =  %.4e', estat(1)));

text(0.10, 0.030, sprintf('MIN PROB BAR HEIGHT =  %f', H1min)) ;

text(0.10, 0.025, sprintf('MAX PROB BAR HEIGHT = %f', H1max)) ;

text(0.10, 0.020, sprintf('                                 SIGMA = %f', estat(2))) ;

subplot(2, 1, 2);

bar(Q, H2); axis([-0.5, 0.5, -0.001, 4/128]); grid on;

%title('Normalized error e2');

xlabel('Normalized error e2'); ylabel('Distribution of e2', 'vertical', 'baseline');

set(gca, 'YTickMode', 'manual', 'YTick', [0, 1:1:4]/128 );

text(-0.45, 0.030, sprintf('SAMPLE SIZE N = %d', N));

text(-0.45, 0.025, sprintf(' ROUNDED TO B = %d BITS', B));

text(-0.45, 0.020, sprintf('                   MEAN  =  %.4e', estat(3)));

text(0.10, 0.030, sprintf('MIN PROB BAR HEIGHT =  %f', H2min)) ;

text(0.10, 0.025, sprintf('MAX PROB BAR HEIGHT = %f', H2max)) ;

text(0.10, 0.020, sprintf('                                 SIGMA = %f', estat(4))) ;

%% ---------------------------------------------------------------------

%%      B = 6

%% ---------------------------------------------------------------------

% Example parameters

B = 6; N = 500000; n = [1:N];

xn = (1/3)*(sin(n/11) + sin(n/31) + cos(n/67)); clear n;

% Quantization error analysis

[H1, H2, Q, estat] = StatModelR(xn, B, N);          % Compute histograms

H1max = max(H1); H1min = min(H1);                   % Max and Min of H1

H2max = max(H2); H2min = min(H2);                   % Max and Min of H2

Hf2 = figure('units', 'inches', 'position', [1, 1, 8, 6], ...

	'paperunits', 'inches', 'paperposition', [0, 0, 6, 4], ...

	'NumberTitle', 'off', 'Name', 'Exameple 10.1b');

set(gcf,'Color','white');

TF = 10;

subplot(2, 1, 1);

bar(Q, H1); axis([-0.5, 0.5, -0.001, 4/128]); grid on;

title('Normalized error e1'); ylabel('Distribution of e1 ', 'vertical', 'baseline');

set(gca, 'YTickMode', 'manual', 'YTick', [0, 1:1:4]/128 );

text(-0.45, 0.030, sprintf('SAMPLE SIZE N = %d', N));

text(-0.45, 0.025, sprintf(' ROUNDED TO B = %d BITS', B));

text(-0.45, 0.020, sprintf('                   MEAN  =  %.4e', estat(1)));

text(0.10, 0.030, sprintf('MIN PROB BAR HEIGHT =  %f', H1min)) ;

text(0.10, 0.025, sprintf('MAX PROB BAR HEIGHT = %f', H1max)) ;

text(0.10, 0.020, sprintf('                                 SIGMA = %.7f', estat(2))) ;

subplot(2, 1, 2);

bar(Q, H2); axis([-0.5, 0.5, -0.001, 4/128]); grid on;

title('Normalized error e2'); ylabel('Distribution of e2', 'vertical', 'baseline');

set(gca, 'YTickMode', 'manual', 'YTick', [0, 1:1:4]/128 );

text(-0.45, 0.030, sprintf('SAMPLE SIZE N = %d', N));

text(-0.45, 0.025, sprintf(' ROUNDED TO B = %d BITS', B));

text(-0.45, 0.020, sprintf('                   MEAN  =  %.4e', estat(3)));

text(0.10, 0.030, sprintf('MIN PROB BAR HEIGHT =  %f', H2min)) ;

text(0.10, 0.025, sprintf('MAX PROB BAR HEIGHT = %f', H2max)) ;

text(0.10, 0.020, sprintf('                                 SIGMA = %.7f', estat(4))) ;
运行结果:
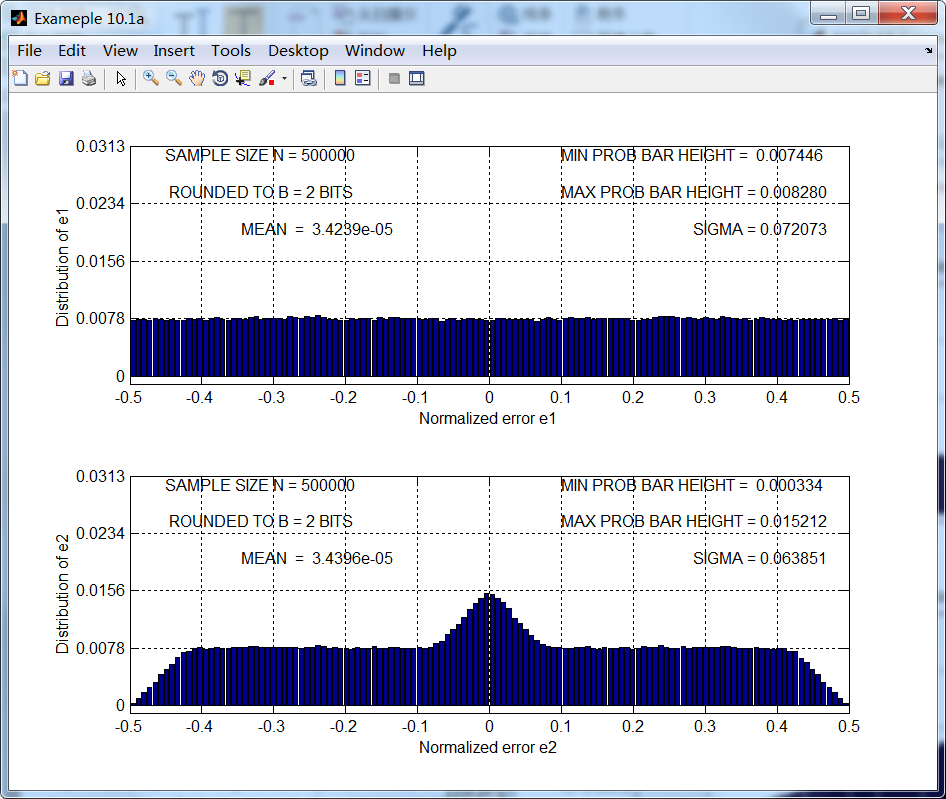
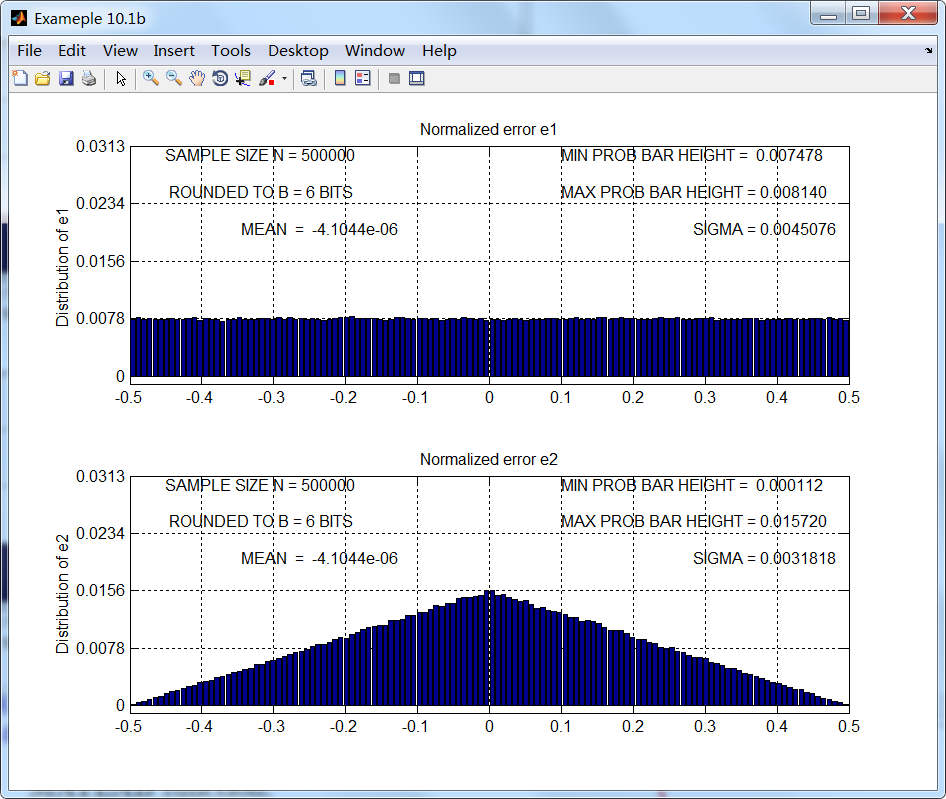
B=2的结果如第1张图所示,很明显,即使误差看起来均匀分布,但误差采样序列不是独立的。对应B=6的
结果如第2张图所示,当B≥6时,结果满足误差模型假设条件。
《DSP using MATLAB》示例 Example 10.1的更多相关文章
- DSP using MATLAB 示例 Example3.10
用到的性质 上代码: n = -5:10; x = rand(1,length(n)) + j * rand(1,length(n)); k = -100:100; w = (pi/100)*k; % ...
- DSP using MATlAB 示例Example2.10
上代码 % noise sequence 1 x = [3, 11, 7, 0, -1, 4, 2]; nx = [-3:3]; % given signal x(n) [y,ny] = sigshi ...
- DSP using MATLAB 示例Example3.21
代码: % Discrete-time Signal x1(n) % Ts = 0.0002; n = -25:1:25; nTs = n*Ts; Fs = 1/Ts; x = exp(-1000*a ...
- DSP using MATLAB 示例 Example3.19
代码: % Analog Signal Dt = 0.00005; t = -0.005:Dt:0.005; xa = exp(-1000*abs(t)); % Discrete-time Signa ...
- DSP using MATLAB示例Example3.18
代码: % Analog Signal Dt = 0.00005; t = -0.005:Dt:0.005; xa = exp(-1000*abs(t)); % Continuous-time Fou ...
- DSP using MATLAB 示例 Example3.13
上代码: w = [0:1:500]*pi/500; % freqency between 0 and +pi, [0,pi] axis divided into 501 points. H = ex ...
- DSP using MATLAB 示例 Example3.12
用到的性质 代码: n = -5:10; x = sin(pi*n/2); k = -100:100; w = (pi/100)*k; % freqency between -pi and +pi , ...
- DSP using MATLAB 示例 Example3.11
用到的性质 上代码: n = -5:10; x = rand(1,length(n)); k = -100:100; w = (pi/100)*k; % freqency between -pi an ...
- DSP using MATLAB 示例Example3.8
代码: x = rand(1,11); n = 0:10; k = 0:500; w = (pi/500)*k; % [0,pi] axis divided into 501 points. X = ...
- DSP using MATLAB 示例Example3.7
上代码: x1 = rand(1,11); x2 = rand(1,11); n = 0:10; alpha = 2; beta = 3; k = 0:500; w = (pi/500)*k; % [ ...
随机推荐
- java之throw和throws
抛出异常有三种形式,一是throw,一个throws,还有一种系统自动抛异常.下面它们之间的异同. 一.系统自动抛异常 当程序语句出现一些逻辑错误.主义错误或类型转换错误时,系统会自动抛出异常:(举个 ...
- uva11324 有向图的强连通分量+记忆化dp
给一张有向图G, 求一个结点数最大的结点集,使得该结点集中任意两个结点u和v满足,要么u可以到达v, 要么v可以到达u(u和v相互可达也可以). 因为整张图可能存在环路,所以不好使用dp直接做,先采用 ...
- hdu5110 dp
题意 给 了 一 个 矩 阵 然 后 , 潜 艇 可 以 向 前 在 西北和东北之间 的区域, 然后每个潜艇有一个值D ,当到达潜艇距离为D的倍数的时候可以得到这个价值,这样我们1000*1000 的 ...
- uva 1456
这题说的是 给了 n 个 点 然后每个点 都有 相应的概率,你要将这n个点划分成w个集合使得 下面定义的这种算法 得到的 值最小 n1 是集合一的 个数 是 集合一内的每个点的概率和, 下面是分成两 ...
- CSS实现超出DIV宽度文字自动隐藏并显示省略号
当文字超出DIV宽度时,超出的文字部分省略,并用显示省略号代替,css代码如下: div.ellipsis { padding-left: 5px; text-align: left; text-ov ...
- springcloud21---Config-bus实现配置自动刷新
Pivotal(毕威拓)有VMware和EMC成立的. RabbitMQ是由ERlang(爱立信开发的,面向并发的编程语言),安装RabbitMQ先要安装ERlang. package com.itm ...
- 用通俗的语言解释restful
实现了REST规范的Web API就叫RESTful API. 简单来说:就是用url定位资源,用http描述来操作资源. web是什么:分布式信息系统为超文本文件和其他对象(资源)提供访问入口. 资 ...
- Refactoring #001 Extract Method
Example public void startup() { ServerSocket serverSocket = null; try { serverSocket = new ServerSoc ...
- git clone时提示(gnome-ssh-askpass:29288): Gtk-WARNING **: cannot open display:
一.背景 在服务器上克隆源码 二.解决 unset SSH_ASKPSS
- Java8 Predicate
code: package com.qhong; import java.util.ArrayList; import java.util.Arrays; import java.util.List; ...