C# GDI绘制波形图
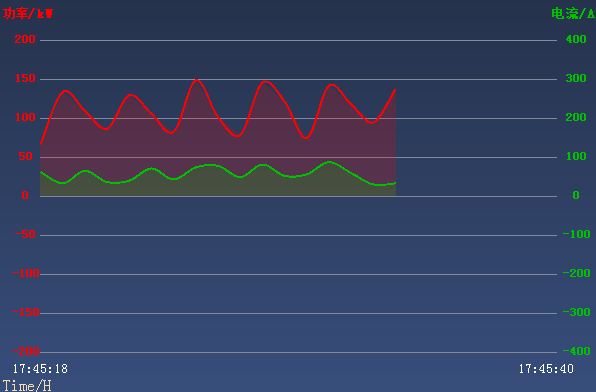
直接上效果图如下
public partial class WaveChartUserCtrl : UserControl
{
Color axisColor = Color.FromArgb(69, 200, 255);//坐标颜色
Color scaleColor = Color.FromArgb(129, 137, 156);//刻度颜色
Font axisFont = new Font("宋体", 9, FontStyle.Bold);//坐标字体 /// <summary>
/// 画板宽度
/// </summary>
private float boardWidth; /// <summary>
/// 画板高度
/// </summary>
private float boardHeight; /// <summary>
/// 垂直(纵向)边距(画图区域距离左右两边长度)
/// </summary>
private float verticalMargin; /// <summary>
/// 平行(横向)边距(画图区域距离左右两边长度)
/// </summary>
private float horizontalMargin; /// <summary>
/// 水平间距像素
/// </summary>
private float horizontalBetween; /// <summary>
/// 垂直间距像素
/// </summary>
private float verticalBetween; /// <summary>
/// 图表区域宽度
/// </summary>
float chartWidth; /// <summary>
/// 图表区域高度
/// </summary>
float charHeight; /// <summary>
/// 画图区域起点
/// </summary>
PointF startPostion; /// <summary>
/// 画图区域终点
/// </summary>
PointF endPostion; /// <summary>
/// 左边Y轴每个间隔值
/// </summary>
private int leftIntervalValueY;
/// <summary>
/// 右边Y抽每个间隔值
/// </summary>
private int rightIntervalValueY;
/// <summary>
/// X轴每个间隔值
/// </summary>
//private int intervalValueX;
/// <summary>
/// X轴刻度线数量
/// </summary>
private int xScaleCount = 20;
/// <summary>
/// X轴刻度线数量
/// </summary>
public int XscaleCount
{
get
{
return xScaleCount;
}
set
{
xScaleCount = value;
}
} /// <summary>
/// Y轴刻度线数量
/// </summary>
private int yScaleCount = 8;
/// <summary>
/// Y轴刻度线数量
/// </summary>
public int YscaleCount
{
get
{
return yScaleCount;
}
} private float leftmaxValue = 300;
[Category("wyl")]
[Description("左边坐标最大值")]
public float LeftMaxValue
{
get
{
return leftmaxValue;
}
set
{
if (value <= LeftMinValue)
{
MessageBox.Show("最大值不能低于最小值!", "警告", MessageBoxButtons.OK, MessageBoxIcon.Warning);
//maxValue = 300;
}
else
{
leftmaxValue = value;
}
}
}
private float leftminValue = 0; /// <summary>
/// 仪表盘显示的最小值
/// </summary>
[Category("wyl")]
[Description("左边坐标最小值")]
public float LeftMinValue
{
get
{
return leftminValue;
}
set
{
if (value >= LeftMaxValue)
{
MessageBox.Show("最小值不能超过最大值!", "警告", MessageBoxButtons.OK, MessageBoxIcon.Warning);
//minValue = 0;
}
else
{
leftminValue = value;
}
} } private float rightmaxValue = 100;
[Category("wyl")]
[Description("右边坐标最大值")]
public float RightMaxValue
{
get
{
return rightmaxValue;
}
set
{
if (value <= RightMinValue)
{
MessageBox.Show("最大值不能低于最小值!", "警告", MessageBoxButtons.OK, MessageBoxIcon.Warning); }
else
{
rightmaxValue = value;
}
}
}
private float rightminValue = 0; /// <summary>
/// 仪表盘显示的最小值
/// </summary>
[Category("wyl")]
[Description("右边坐标最小值")]
public float RightMinValue
{
get
{
return rightminValue;
}
set
{
if (value >= RightMaxValue)
{
MessageBox.Show("最小值不能超过最大值!", "警告", MessageBoxButtons.OK, MessageBoxIcon.Warning); }
else
{
rightminValue = value;
//InitCanvas();
}
} } private List<Color> lineColor = new List<Color> { Color.Red, Color.FromArgb(0, 192, 0) };
[Category("wyl")]
[Description("线条颜色")]
public List<Color> LineColor
{
get
{
return lineColor;
}
set
{
if (value != null && value.Count > 1)
{
lineColor = value;
} }
} /// <summary>
/// 显示文字
/// </summary>
string titlText1 = "";
/// <summary>
/// 显示文字
/// </summary>
[Category("wyl")]
[Description("标题1")]
public string TitlText1
{
get
{
return titlText1;
}
set
{
titlText1 = value;
}
}
/// <summary>
/// 显示文字
/// </summary>
string titlText2 = "";
/// <summary>
/// 显示文字
/// </summary>
[Category("wyl")]
[Description("标题2")]
public string TitlText2
{
get
{
return titlText2;
}
set
{
titlText2 = value;
}
} /// <summary>
/// 数据源1
/// </summary>
private Series SeriesData1 = new Series();
/// <summary>
/// 数据源2
/// </summary>
private Series SeriesData2 = new Series(); /// <summary>
/// 真实画布宽度为画板的80% ,其余部分预留。
/// </summary>
private float canvasWidth; /// <summary>
/// 最大X抽坐标为24H,最后记录一分钟记录一次
/// </summary>
private int MaxXScaleCount = 720;//24 * 60 / 2;//2秒通讯一次,最大每一分钟记录一次 //private List<float> dataLst1 = new List<float>();
//private List<float> dataLst2 = new List<float>(); public DateTime startTime = DateTime.Now; public void InitCanvas()
{
boardWidth = this.ClientSize.Width;
boardHeight = this.ClientSize.Height;
horizontalMargin = 40;
verticalMargin = 40;
chartWidth = boardWidth - 2 * horizontalMargin;//画图区域宽度
charHeight = boardHeight - 2 * verticalMargin; //画图区域高度,axisY 避免与X轴重合
canvasWidth = chartWidth * 0.86F;//实际画布为画板的80%
startPostion = new PointF(horizontalMargin, verticalMargin);
endPostion = new PointF(boardWidth - horizontalMargin, boardHeight - verticalMargin); //SeriesData1.LineColor = Color.Red;
//SeriesData2.LineColor = Color.FromArgb(0, 192, 0); } public WaveChartUserCtrl()
{
InitializeComponent();
this.SetStyle(ControlStyles.OptimizedDoubleBuffer
| ControlStyles.AllPaintingInWmPaint
| ControlStyles.DoubleBuffer, true);
InitCanvas(); } /// <summary>
/// 画图
/// </summary>
/// <param name="gp"></param>
private void Drawing(Graphics gs)
{
System.Diagnostics.Stopwatch runstopwatch = new System.Diagnostics.Stopwatch();
runstopwatch.Start();
if (SeriesData1.Datas.Count > 20)
{
XscaleCount = SeriesData1.Datas.Count;
}
horizontalBetween = canvasWidth / XscaleCount;
verticalBetween = charHeight / YscaleCount;
//intervalValueX = 1;//
leftIntervalValueY = (int)(LeftMaxValue - LeftMinValue) / YscaleCount;
rightIntervalValueY = (int)(RightMaxValue - RightMinValue) / YscaleCount; try
{
StringFormat strFmt = new System.Drawing.StringFormat();
strFmt.Alignment = StringAlignment.Center; //文本水平居中
strFmt.LineAlignment = StringAlignment.Center; //文本垂直居中
Pen axisPen = new Pen(scaleColor, 1.0F);//坐标文字
Bitmap bit = new Bitmap((int)boardWidth, (int)boardHeight);
Graphics g = Graphics.FromImage(bit);
//g.DrawString(TitlText, new Font("宋体", 9, FontStyle.Bold), new SolidBrush(SeriesData1.LineColor), 5, 10);
float tempEndPointY = endPostion.Y;
//Y轴格
for (int i = 0; i <= YscaleCount; i++)
{
float y = tempEndPointY - i * verticalBetween;
g.DrawLine(axisPen, startPostion.X, y, endPostion.X, y); string leftText = (LeftMinValue + (i * leftIntervalValueY)).ToString();
SizeF sf = g.MeasureString(leftText, axisFont);
RectangleF rf = new RectangleF(startPostion.X - 30, y - sf.Height / 2, 30, sf.Height);
g.DrawString(leftText, axisFont, new SolidBrush(LineColor[0]), rf, strFmt); string rightText = (RightMinValue + (i * rightIntervalValueY)).ToString();
sf = g.MeasureString(rightText, axisFont);
RectangleF rf1 = new RectangleF(endPostion.X + 5, y - sf.Height / 2, 30, sf.Height);
g.DrawString(rightText, axisFont, new SolidBrush(LineColor[1]), rf1, strFmt); } //画曲线
if (SeriesData1 != null)
{
strFmt.Alignment = StringAlignment.Near; //
RectangleF rf = new RectangleF(0, 0, 70, 30);
g.DrawString(TitlText1, new Font("宋体", 10, FontStyle.Bold), new SolidBrush(LineColor[0]), rf, strFmt);
//计算0值的坐标
int tempv = (int)((Math.Abs(LeftMinValue) - 0) / leftIntervalValueY);//得到0到最小值的间隔距离;
float zeroY = tempEndPointY - tempv * verticalBetween;//值为0点Y抽坐标;
if (SeriesData1.Datas.Count > 1)
{
int dataIndex = 0;
PointF[] arrDataPoint = new PointF[SeriesData2.Datas.Count];
int index = 0;
foreach (PointF pf in SeriesData1.Datas)
{
PointF p = new PointF();
p.X = startPostion.X + horizontalBetween * index;
p.Y = zeroY - verticalBetween * pf.Y / leftIntervalValueY;
arrDataPoint[dataIndex++] = p;
index++;
}
g.DrawCurve(new Pen(new SolidBrush(LineColor[0]), 2F), arrDataPoint);
PointF[] AreaPf = new PointF[arrDataPoint.Length + 2];
int AreaIndxe = 0;
AreaPf[AreaIndxe++] = new PointF(startPostion.X, zeroY);
foreach (PointF p in arrDataPoint)
{
AreaPf[AreaIndxe++] = p;
}
AreaPf[AreaIndxe++] = new PointF(arrDataPoint[arrDataPoint.Length - 1].X, zeroY);
g.FillPolygon(new SolidBrush(Color.FromArgb(50, LineColor[0])), AreaPf);
//g.FillClosedCurve(new SolidBrush(Color.FromArgb(50, SeriesData1.LineColor)), AreaPf);
//g.DrawEllipse(new Pen(Brushes.Red), startPostion.X, zeroY, 10, 10);
}
}
if (SeriesData2 != null)
{
strFmt.Alignment = StringAlignment.Far; //
RectangleF rf = new RectangleF(boardWidth - 70, 0, 70, 30);
g.DrawString(TitlText2, new Font("宋体", 10, FontStyle.Bold), new SolidBrush(LineColor[1]), rf, strFmt);
//计算0值的坐标
int tempv = (int)((Math.Abs(RightMinValue) - 0) / rightIntervalValueY);//得到0到最小值的间隔距离;
float zeroY = tempEndPointY - tempv * verticalBetween;//值为0点Y抽坐标;
if (SeriesData2.Datas.Count > 1)
{
int dataIndex = 0;
PointF[] arrDataPoint = new PointF[SeriesData2.Datas.Count];
int index = 0;
foreach (PointF pf in SeriesData2.Datas)
{
PointF p = new PointF();
p.X = startPostion.X + horizontalBetween * index;
p.Y = zeroY - verticalBetween * pf.Y / rightIntervalValueY;
arrDataPoint[dataIndex++] = p;
index++;
}
g.DrawCurve(new Pen(new SolidBrush(LineColor[1]), 2F), arrDataPoint);
PointF[] AreaPf = new PointF[arrDataPoint.Length + 2];
int AreaIndxe = 0;
AreaPf[AreaIndxe++] = new PointF(startPostion.X, zeroY);
foreach (PointF p in arrDataPoint)
{
AreaPf[AreaIndxe++] = p;
}
AreaPf[AreaIndxe++] = new PointF(arrDataPoint[SeriesData2.Datas.Count - 1].X, zeroY);
g.FillPolygon(new SolidBrush(Color.FromArgb(50, LineColor[1])), AreaPf);
}
}
g.DrawString(startTime.ToString("HH:mm:ss"), new Font("宋体", 10, FontStyle.Regular), Brushes.White, 10, this.ClientSize.Height - 30);
g.DrawString(DateTime.Now.ToString("HH:mm:ss"), new Font("宋体", 10, FontStyle.Regular), Brushes.White, this.ClientSize.Width - 80, this.ClientSize.Height - 30);
g.DrawString("Time/H", new Font("宋体", 12, FontStyle.Regular), Brushes.Wheat, 0, this.ClientSize.Height - 15);
gs.DrawImage(bit, 0, 0);
g.Dispose(); runstopwatch.Stop();
TimeSpan timespan = runstopwatch.Elapsed;
Console.WriteLine("Drawing:" + timespan.ToString());
}
catch (Exception ex)
{
Console.WriteLine(ex.Message);
}
} private void WaveChartUserCtrl_Resize(object sender, EventArgs e)
{
InitCanvas();
this.Refresh();
} private void WaveChartUserCtrl_Paint(object sender, PaintEventArgs e)
{
Drawing(e.Graphics);
} public void AddSeriesData(List<float> dataLst1, List<float> dataLst2)
{
//System.Diagnostics.Stopwatch runstopwatch = new System.Diagnostics.Stopwatch();
//runstopwatch.Start(); //dataLst1.Add(y1);
//dataLst2.Add(y2);
//if (dataLst1.Count > 86400)
//{
// dataLst1.RemoveAt(0);
//}
//if (dataLst2.Count > 86400)
//{
// dataLst2.RemoveAt(0);
//} int tempx = dataLst1.Count / MaxXScaleCount + 1;
SeriesData1.Datas.Clear();
for (int index = 0; index < dataLst1.Count; index++)
{
PointF p1 = new PointF(0, dataLst1[index]);
if (index % tempx == 0 || index == dataLst1.Count)
{
SeriesData1.Datas.Add(p1);
}
}
SeriesData2.Datas.Clear();
for (int index = 0; index < dataLst2.Count; index++)
{
PointF p2 = new PointF(0, dataLst2[index]);
if (index % tempx == 0 || index == dataLst2.Count)
{
SeriesData2.Datas.Add(p2);
}
} //runstopwatch.Stop();
//TimeSpan timespan = runstopwatch.Elapsed;
//Console.WriteLine(timespan.ToString()); //this.Refresh();
} } /// <summary>
/// 数据系列管理
/// </summary>
public class Series
{
/// <summary>
/// 标题
/// </summary>
public string HeadText = "title"; Color lineColor = Color.Red;
/// <summary>
/// 当前画笔颜色
/// </summary>
public Color LineColor
{
get
{
return lineColor;
}
set
{
lineColor = value;
}
} public List<PointF> Datas = new List<PointF>();
}
C# GDI绘制波形图的更多相关文章
- 通过GDI+绘制 验证码
只为了记录下自己的学习历程,方便日后查看 现在开始言归正传,以下为其完整代码附上 using System; using System.Collections.Generic; using Syste ...
- C#利用GDI+绘制旋转文字等效果
C#中利用GDI+绘制旋转文本的文字,网上有很多资料,基本都使用矩阵旋转的方式实现.但基本都只提及按点旋转,若要实现在矩形范围内旋转文本,资料较少.经过琢磨,可以将矩形内旋转转化为按点旋转,不过需要经 ...
- C# 使用GDI+绘制漂亮的MenuStrip和ContextMenuStrip皮肤
通过上面的效果截图可以看到,重绘后的MenuStrip和ContextMenuStrip可以添加自己的LOGO信息,实现了类似OFFICE2007的菜单显示效果. .NET对菜单控件的绘制提供了一个抽 ...
- MFC 用gdi绘制填充多边形区域
MFC 用gdi绘制填充多边形区域 这里的代码是实现一个三角形的绘制,并用刷子填充颜色 在OnPaint()函数里面 运用的是给定的三角形的三个点,很多个点可以绘制多边形 CBrush br(RGB( ...
- GDI绘制时钟效果,与系统时间保持同步,基于Winform
2018年工作之余,想起来捡起GDI方面的技术,特意在RichCodeBox项目中做了两个示例程序,其中一个就是时钟效果,纯C#开发.这个CSharpQuartz是今天上午抽出一些时间,编写的,算是偷 ...
- 『备注』GDI+ 绘制文本有锯齿,透明背景文本绘制
背景: GDI+ 绘制文本 时,如果 背景是透明的 —— 则会出现 锯齿. //其实,我不用这三个 属性 好多年了 //而且,这三个属性 在关键时刻还有可能 帮倒忙 //关键是:这三个属性,鸟用都没有 ...
- C#GDI+ 绘制线段(实线或虚线)、矩形、字符串、圆、椭圆
C#GDI+ 绘制线段(实线或虚线).矩形.字符串.圆.椭圆 绘制基本线条和图形 比较简单,直接看代码. Graphics graphics = e.Graphics; //绘制实线 )) { pen ...
- Python 读取WAV文件并绘制波形图
aa Python 读取WAV文件并绘制波形图 ffmpeg -i test_pcm_mulaw.wav -f wav -codec:a pcm_s16le -ar 8000 -ac 1 out.wa ...
- C# GDI绘制仪表盘(纯代码实现)
纯代码实现GDI绘制仪表盘,效果在代码下面. public partial class HalfDashboardUc : UserControl { /// <summary> /// ...
随机推荐
- 使用VisualStudio开发php的图文设置方法[xyytit]
早先在asp横行的年代,php和asp一样,大都都是html中夹杂代码,说实话,这时候IDE的确用处不是很大,倒是类似于dw之类的设计器甚为上手. 现在,三层.mvc之类的思想遍地开花,使得代码和 ...
- springMVC使用@RequestParam用于处理简单类型的绑定
使用@RequestParam常用于处理简单类型的绑定. value:参数名字,即入参的请求参数名字,如value=“item_id”表示请求的参数区中的名字为item_id的参数的值将传入: req ...
- MSVCR90D.dll
http://stackoverflow.com/questions/218747/msvcr90d-dll-not-found-in-debug-mode-with-visual-c-2008 I ...
- Laravel Nginx 站点配置文件(Homestead)
server { listen 80; listen 443 ssl http2; server_name fmtmis.local; root "/home ...
- 如何用Mockplus快速做一个手风琴菜单?
手风琴菜单是一种比较常用的菜单形式,利用原型工具来做这种菜单通常要用到中继器.即使是功能强大的Axure,想实现该效果也比较麻烦.但如果你对Mockplus有所了解,你一定知道,利用Mockplus的 ...
- Linux操作系统Vim代码Tab自动补全配置
function! CleverTab() , col( ) =~ '^\s*$' return "\<Tab>" else return "\<C-N ...
- 2018.10.15 loj#6010. 「网络流 24 题」数字梯形(费用流)
传送门 费用流经典题. 按照题目要求建边. 为了方便我将所有格子拆点,三种情况下容量分别为111,infinfinf,infinfinf,费用都为validi,jval_{id_{i,j}}valid ...
- 2018.10.14 loj#6012. 「网络流 24 题」分配问题(费用流)
传送门 费用流水题. 依然是照着题意模拟建边就行了. 为了练板子又重新写了一遍费用流. 代码: #include<bits/stdc++.h> #define N 305 #define ...
- 38 Cell-phone Emissions can change Brain Activity 手机辐射有可能改变大脑活动
Cell-phone Emissions can change Brain Activity 手机辐射有可能改变大脑活动 So many people use the cell phone so fr ...
- 电信网上营业厅-客户充值缴费时间段数据挖掘--spss
最近研究分析了“云南电信网上营业厅”e9宽带续约缴费的数据,目前宽带续约量为171人,今天需要谈论的是:如何利用SPSS挖掘出“客户充值缴费的时间段”客户喜欢在哪个时间段来网厅进行充值缴费 云南电信网 ...