
吴裕雄 python 机器学习——集成学习梯度提升决策树GradientBoostingRegressor回归模型
import numpy as np

import matplotlib.pyplot as plt

from sklearn import datasets,ensemble

from sklearn.model_selection import train_test_split

def load_data_regression():

    '''

    加载用于回归问题的数据集

    '''

    #使用 scikit-learn 自带的一个糖尿病病人的数据集

    diabetes = datasets.load_diabetes()

    # 拆分成训练集和测试集,测试集大小为原始数据集大小的 1/4

    return train_test_split(diabetes.data,diabetes.target,test_size=0.25,random_state=0)

#集成学习梯度提升决策树GradientBoostingRegressor回归模型

def test_GradientBoostingRegressor(*data):

    X_train,X_test,y_train,y_test=data

    regr=ensemble.GradientBoostingRegressor()

    regr.fit(X_train,y_train)

    print("Training score:%f"%regr.score(X_train,y_train))

    print("Testing score:%f"%regr.score(X_test,y_test))

# 获取分类数据

X_train,X_test,y_train,y_test=load_data_regression()

# 调用 test_GradientBoostingRegressor

test_GradientBoostingRegressor(X_train,X_test,y_train,y_test)

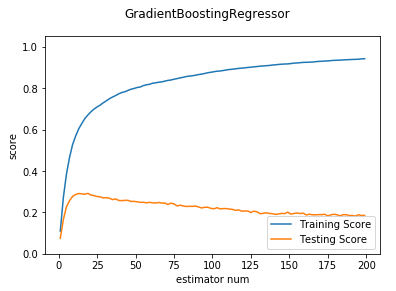
def test_GradientBoostingRegressor_num(*data):

    '''

    测试 GradientBoostingRegressor 的预测性能随 n_estimators 参数的影响

    '''

    X_train,X_test,y_train,y_test=data

    nums=np.arange(1,200,step=2)

    fig=plt.figure()

    ax=fig.add_subplot(1,1,1)

    testing_scores=[]

    training_scores=[]

    for num in nums:

        regr=ensemble.GradientBoostingRegressor(n_estimators=num)

        regr.fit(X_train,y_train)

        training_scores.append(regr.score(X_train,y_train))

        testing_scores.append(regr.score(X_test,y_test))

    ax.plot(nums,training_scores,label="Training Score")

    ax.plot(nums,testing_scores,label="Testing Score")

    ax.set_xlabel("estimator num")

    ax.set_ylabel("score")

    ax.legend(loc="lower right")

    ax.set_ylim(0,1.05)

    plt.suptitle("GradientBoostingRegressor")

    plt.show()

# 调用 test_GradientBoostingRegressor_num

test_GradientBoostingRegressor_num(X_train,X_test,y_train,y_test)
def test_GradientBoostingRegressor_maxdepth(*data):

    '''

    测试 GradientBoostingRegressor 的预测性能随 max_depth 参数的影响

    '''

    X_train,X_test,y_train,y_test=data

    maxdepths=np.arange(1,20)

    fig=plt.figure()

    ax=fig.add_subplot(1,1,1)

    testing_scores=[]

    training_scores=[]

    for maxdepth in maxdepths:

        regr=ensemble.GradientBoostingRegressor(max_depth=maxdepth,max_leaf_nodes=None)

        regr.fit(X_train,y_train)

        training_scores.append(regr.score(X_train,y_train))

        testing_scores.append(regr.score(X_test,y_test))

    ax.plot(maxdepths,training_scores,label="Training Score")

    ax.plot(maxdepths,testing_scores,label="Testing Score")

    ax.set_xlabel("max_depth")

    ax.set_ylabel("score")

    ax.legend(loc="lower right")

    ax.set_ylim(-1,1.05)

    plt.suptitle("GradientBoostingRegressor")

    plt.show()

# 调用 test_GradientBoostingRegressor_maxdepth

test_GradientBoostingRegressor_maxdepth(X_train,X_test,y_train,y_test)

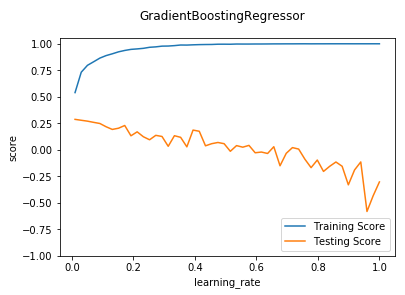
def test_GradientBoostingRegressor_learning(*data):

    '''

    测试 GradientBoostingRegressor 的预测性能随 learning_rate 参数的影响

    '''

    X_train,X_test,y_train,y_test=data

    learnings=np.linspace(0.01,1.0)

    fig=plt.figure()

    ax=fig.add_subplot(1,1,1)

    testing_scores=[]

    training_scores=[]

    for learning in learnings:

        regr=ensemble.GradientBoostingRegressor(learning_rate=learning)

        regr.fit(X_train,y_train)

        training_scores.append(regr.score(X_train,y_train))

        testing_scores.append(regr.score(X_test,y_test))

    ax.plot(learnings,training_scores,label="Training Score")

    ax.plot(learnings,testing_scores,label="Testing Score")

    ax.set_xlabel("learning_rate")

    ax.set_ylabel("score")

    ax.legend(loc="lower right")

    ax.set_ylim(-1,1.05)

    plt.suptitle("GradientBoostingRegressor")

    plt.show()

# 调用 test_GradientBoostingRegressor_learning

test_GradientBoostingRegressor_learning(X_train,X_test,y_train,y_test)
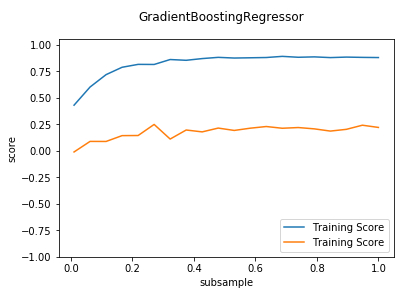
def test_GradientBoostingRegressor_subsample(*data):

    '''

    测试 GradientBoostingRegressor 的预测性能随 subsample 参数的影响

    '''

    X_train,X_test,y_train,y_test=data

    fig=plt.figure()

    ax=fig.add_subplot(1,1,1)

    subsamples=np.linspace(0.01,1.0,num=20)

    testing_scores=[]

    training_scores=[]

    for subsample in subsamples:

        regr=ensemble.GradientBoostingRegressor(subsample=subsample)

        regr.fit(X_train,y_train)

        training_scores.append(regr.score(X_train,y_train))

        testing_scores.append(regr.score(X_test,y_test))

    ax.plot(subsamples,training_scores,label="Training Score")

    ax.plot(subsamples,testing_scores,label="Training Score")

    ax.set_xlabel("subsample")

    ax.set_ylabel("score")

    ax.legend(loc="lower right")

    ax.set_ylim(-1,1.05)

    plt.suptitle("GradientBoostingRegressor")

    plt.show()

# 调用 test_GradientBoostingRegressor_subsample

test_GradientBoostingRegressor_subsample(X_train,X_test,y_train,y_test)
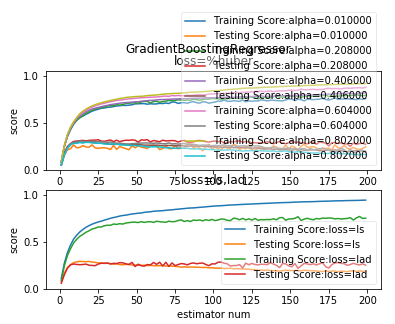
def test_GradientBoostingRegressor_loss(*data):

    '''

    测试 GradientBoostingRegressor 的预测性能随不同的损失函数和 alpha 参数的影响

    '''

    X_train,X_test,y_train,y_test=data

    fig=plt.figure()

    nums=np.arange(1,200,step=2)

    ########## 绘制 huber ######

    ax=fig.add_subplot(2,1,1)

    alphas=np.linspace(0.01,1.0,endpoint=False,num=5)

    for alpha in alphas:

        testing_scores=[]

        training_scores=[]

        for num in nums:

            regr=ensemble.GradientBoostingRegressor(n_estimators=num,loss='huber',alpha=alpha)

            regr.fit(X_train,y_train)

            training_scores.append(regr.score(X_train,y_train))

            testing_scores.append(regr.score(X_test,y_test))

        ax.plot(nums,training_scores,label="Training Score:alpha=%f"%alpha)

        ax.plot(nums,testing_scores,label="Testing Score:alpha=%f"%alpha)

    ax.set_xlabel("estimator num")

    ax.set_ylabel("score")

    ax.legend(loc="lower right",framealpha=0.4)

    ax.set_ylim(0,1.05)

    ax.set_title("loss=%huber")

    plt.suptitle("GradientBoostingRegressor")

    #### 绘制 ls  和 lad

    ax=fig.add_subplot(2,1,2)

    for loss in ['ls','lad']:

        testing_scores=[]

        training_scores=[]

        for num in nums:

            regr=ensemble.GradientBoostingRegressor(n_estimators=num,loss=loss)

            regr.fit(X_train,y_train)

            training_scores.append(regr.score(X_train,y_train))

            testing_scores.append(regr.score(X_test,y_test))

        ax.plot(nums,training_scores,label="Training Score:loss=%s"%loss)

        ax.plot(nums,testing_scores,label="Testing Score:loss=%s"%loss)

    ax.set_xlabel("estimator num")

    ax.set_ylabel("score")

    ax.legend(loc="lower right",framealpha=0.4)

    ax.set_ylim(0,1.05)

    ax.set_title("loss=ls,lad")

    plt.suptitle("GradientBoostingRegressor")

    plt.show()

# 调用 test_GradientBoostingRegressor_loss

test_GradientBoostingRegressor_loss(X_train,X_test,y_train,y_test)
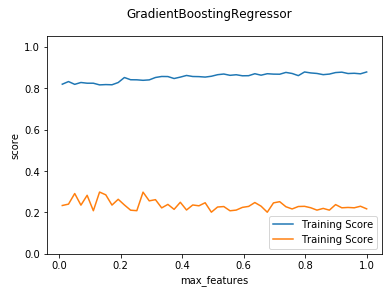
def test_GradientBoostingRegressor_max_features(*data):

    '''

    测试 GradientBoostingRegressor 的预测性能随 max_features 参数的影响

    '''

    X_train,X_test,y_train,y_test=data

    fig=plt.figure()

    ax=fig.add_subplot(1,1,1)

    max_features=np.linspace(0.01,1.0)

    testing_scores=[]

    training_scores=[]

    for features in max_features:

        regr=ensemble.GradientBoostingRegressor(max_features=features)

        regr.fit(X_train,y_train)

        training_scores.append(regr.score(X_train,y_train))

        testing_scores.append(regr.score(X_test,y_test))

    ax.plot(max_features,training_scores,label="Training Score")

    ax.plot(max_features,testing_scores,label="Training Score")

    ax.set_xlabel("max_features")

    ax.set_ylabel("score")

    ax.legend(loc="lower right")

    ax.set_ylim(0,1.05)

    plt.suptitle("GradientBoostingRegressor")

    plt.show()

# 调用 test_GradientBoostingRegressor_max_features

test_GradientBoostingRegressor_max_features(X_train,X_test,y_train,y_test)
吴裕雄 python 机器学习——集成学习梯度提升决策树GradientBoostingRegressor回归模型的更多相关文章
- 吴裕雄 python 机器学习——集成学习随机森林RandomForestRegressor回归模型
import numpy as np import matplotlib.pyplot as plt from sklearn import datasets,ensemble from sklear ...
- 吴裕雄 python 机器学习——集成学习随机森林RandomForestClassifier分类模型
import numpy as np import matplotlib.pyplot as plt from sklearn import datasets,ensemble from sklear ...
- 吴裕雄 python 机器学习——集成学习AdaBoost算法回归模型
import numpy as np import matplotlib.pyplot as plt from sklearn import datasets,ensemble from sklear ...
- 吴裕雄 python 机器学习——集成学习AdaBoost算法分类模型
import numpy as np import matplotlib.pyplot as plt from sklearn import datasets,ensemble from sklear ...
- 吴裕雄 python 机器学习——数据预处理字典学习模型
from sklearn.decomposition import DictionaryLearning #数据预处理字典学习DictionaryLearning模型 def test_Diction ...
- 吴裕雄 python 机器学习——人工神经网络感知机学习算法的应用
import numpy as np from matplotlib import pyplot as plt from sklearn import neighbors, datasets from ...
- 吴裕雄 python 机器学习——人工神经网络与原始感知机模型
import numpy as np from matplotlib import pyplot as plt from mpl_toolkits.mplot3d import Axes3D from ...
- 吴裕雄 python 机器学习——分类决策树模型
import numpy as np import matplotlib.pyplot as plt from sklearn import datasets from sklearn.model_s ...
- 吴裕雄 python 机器学习——回归决策树模型
import numpy as np import matplotlib.pyplot as plt from sklearn import datasets from sklearn.model_s ...
随机推荐
- LaTeX绘图
http://math.uchicago.edu/~weinan/programs/tex_diagrams/diagrams.html 给大家分享下这个,用鼠标画diagrams,然后可以一键复制l ...
- ansible笔记(14):循环(一)
在使用ansible的过程中,我们经常需要处理一些返回信息,而这些返回信息中,通常可能不是单独的一条返回信息,而是一个信息列表,如果我们想要循环的处理信息列表中的每一条信息,我们该怎么办呢?这样空口白 ...
- Vue中封装axios
参考: https://www.jianshu.com/p/7a9fbcbb1114 https://www.cnblogs.com/dreamcc/p/10752604.html 一.安装axios ...
- [ZJOI2009] 狼与羊的故事 - 最小割
给定一个\(N \times M\)方格矩阵,每个格子可在\(0,1,2\)中取值.要求在方格的边上进行划分,使得任意联通块内不同时包含\(1\)和\(2\)的格子. ________________ ...
- windows 服务启动外部程序
服务使用Process启动外部程序没窗体 在WinXP和Win2003环境中,安装服务后,右键单击服务“属性”-“登录”选项卡-选择“本地系统帐户”并勾选“允许服务与桌面交互”即可. 在Win7及以后 ...
- SMTS Silicon Design Engineer Location: Beijing, Beijing, CN
https://jobs.amd.com/job/Beijing-Physical-Design-Engineer-Beij/603603700/?locale=en_US What you do a ...
- IDEA工具java开发之 运行与调试
一.运行项目 ◆右键运行 ◆菜单运行 ◆run窗口运行 ◆启动参数 作用:经常用在本地开发环境要去连测试的数据库的时候使用.正常的情况下是连开发环境的数据库的,但是有些情况是需要连测试数据库的.所以这 ...
- C++-CodeForces-1313A
真的打起比赛来,连个贪心都写不好,呜呜呜. #include <bits/stdc++.h> using namespace std; ],t,ans; void IF(int&a ...
- linux学习笔记1:无操作系统时LED驱动
- sql 应用记录
SELECT * FROM (select aa.*,bb.mentalvisitid, ' then '家庭访视' else '电话' end as BCSFXS ,bb.visitdate, ' ...