
吴裕雄 python 机器学习-KNN(2)
import matplotlib

import numpy as np

import matplotlib.pyplot as plt

from matplotlib.patches import Rectangle

n = 1000 #number of points to create

xcord = np.zeros((n))

ycord = np.zeros((n))

markers =[]

colors =[]

fw = open('D:\\LearningResource\\machinelearninginaction\\Ch02\\EXTRAS\\testSet.txt','w')

for i in range(n):

    [r0,r1] = np.random.standard_normal(2)

    myClass = np.random.uniform(0,1)

    if (myClass <= 0.16):

        fFlyer = np.random.uniform(22000, 60000)

        tats = 3 + 1.6*r1

        markers.append(20)

        colors.append(2.1)

        classLabel = 1 #'didntLike'

        print(("%d, %f, class1") % (fFlyer, tats))

    elif ((myClass > 0.16) and (myClass <= 0.33)):

        fFlyer = 6000*r0 + 70000

        tats = 10 + 3*r1 + 2*r0

        markers.append(20)

        colors.append(1.1)

        classLabel = 1 #'didntLike'

        print(("%d, %f, class1") % (fFlyer, tats))

    elif ((myClass > 0.33) and (myClass <= 0.66)):

        fFlyer = 5000*r0 + 10000

        tats = 3 + 2.8*r1

        markers.append(30)

        colors.append(1.1)

        classLabel = 2 #'smallDoses'

        print(("%d, %f, class2") % (fFlyer, tats))

    else:

        fFlyer = 10000*r0 + 35000

        tats = 10 + 2.0*r1

        markers.append(50)

        colors.append(0.1)

        classLabel = 3 #'largeDoses'

        print(("%d, %f, class3") % (fFlyer, tats))

    if (tats < 0):

        tats =0

    if (fFlyer < 0):

        fFlyer =0

    xcord[i] = fFlyer

    ycord[i]=tats

    fw.write("%d\t%f\t%f\t%d\n" % (fFlyer, tats, np.random.uniform(0.0, 1.7), classLabel))

fw.close()

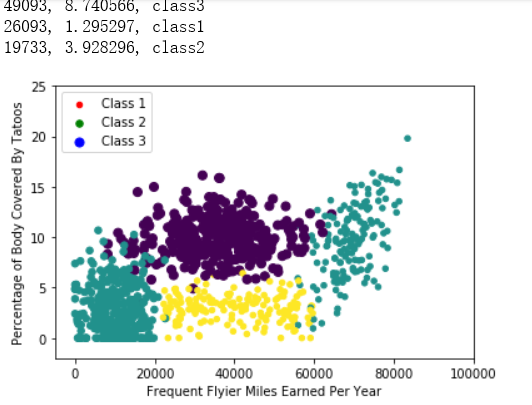
fig = plt.figure()

ax = fig.add_subplot(111)

ax.scatter(xcord,ycord, c=colors, s=markers)

type1 = ax.scatter([-10], [-10], s=20, c='red')

type2 = ax.scatter([-10], [-15], s=30, c='green')

type3 = ax.scatter([-10], [-20], s=50, c='blue')

ax.legend([type1, type2, type3], ["Class 1", "Class 2", "Class 3"], loc=2)

ax.axis([-5000,100000,-2,25])

plt.xlabel('Frequent Flyier Miles Earned Per Year')

plt.ylabel('Percentage of Body Covered By Tatoos')

plt.show()

...................................................
import numpy as np

import matplotlib

import matplotlib.pyplot as plt

from matplotlib.patches import Rectangle

n = 1000 #number of points to create

xcord1 = []; ycord1 = []

xcord2 = []; ycord2 = []

xcord3 = []; ycord3 = []

markers =[]

colors =[]

fw = open('D:\\LearningResource\\machinelearninginaction\\Ch02\\EXTRAS\\testSet.txt','w')

for i in range(n):

    [r0,r1] = np.random.standard_normal(2)

    myClass = np.random.uniform(0,1)

    if (myClass <= 0.16):

        fFlyer = np.random.uniform(22000, 60000)

        tats = 3 + 1.6*r1

        markers.append(20)

        colors.append(2.1)

        classLabel = 1 #'didntLike'

        xcord1.append(fFlyer)

        ycord1.append(tats)

    elif ((myClass > 0.16) and (myClass <= 0.33)):

        fFlyer = 6000*r0 + 70000

        tats = 10 + 3*r1 + 2*r0

        markers.append(20)

        colors.append(1.1)

        classLabel = 1 #'didntLike'

        if (tats < 0):

            tats =0

        if (fFlyer < 0):

            fFlyer =0

        xcord1.append(fFlyer)

        ycord1.append(tats)

    elif ((myClass > 0.33) and (myClass <= 0.66)):

        fFlyer = 5000*r0 + 10000

        tats = 3 + 2.8*r1

        markers.append(30)

        colors.append(1.1)

        classLabel = 2 #'smallDoses'

        if (tats < 0):

            tats =0

        if (fFlyer < 0):

            fFlyer =0

        xcord2.append(fFlyer)

        ycord2.append(tats)

    else:

        fFlyer = 10000*r0 + 35000

        tats = 10 + 2.0*r1

        markers.append(50)

        colors.append(0.1)

        classLabel = 3 #'largeDoses'

        if (tats < 0): tats =0

        if (fFlyer < 0): fFlyer =0

        xcord3.append(fFlyer)

        ycord3.append(tats)

        fw.write("%d\t%f\t%f\t%d\n" % (fFlyer, tats, np.random.uniform(0.0, 1.7), classLabel))

fw.close()

fig = plt.figure()

ax = fig.add_subplot(111)

# ax.scatter(xcord,ycord, c=colors, s=markers)

type1 = ax.scatter(xcord1, ycord1, s=20, c='red')

type2 = ax.scatter(xcord2, ycord2, s=30, c='green')

type3 = ax.scatter(xcord3, ycord3, s=50, c='blue')

ax.legend([type1, type2, type3], ["Did Not Like", "Liked in Small Doses", "Liked in Large Doses"], loc=2)

ax.axis([-5000,100000,-2,25])

plt.xlabel('Frequent Flyier Miles Earned Per Year')

plt.ylabel('Percentage of Time Spent Playing Video Games')

plt.show()

import numpy as np

import matplotlib

import matplotlib.pyplot as plt

def file2matrix(filename):

    fr = open(filename)

    returnMat = []

    classLabelVector = []                       #prepare labels return

    for line in fr.readlines():

        line = line.strip()

        listFromLine = line.split('\t')

        returnMat.append([float(listFromLine[0]),float(listFromLine[1]),float(listFromLine[2])])

        classLabelVector.append(int(listFromLine[-1]))

    return np.array(returnMat),np.array(classLabelVector)

fig = plt.figure()

ax = fig.add_subplot(111)

datingDataMat,datingLabels = file2matrix('D:\\LearningResource\\machinelearninginaction\\Ch02\\datingTestSet2.txt')

#ax.scatter(datingDataMat[:,1], datingDataMat[:,2])

ax.scatter(datingDataMat[:,1], datingDataMat[:,2], 15.0*np.array(datingLabels), 15.0*np.array(datingLabels))

ax.axis([-2,25,-0.2,2.0])

plt.xlabel('Percentage of Time Spent Playing Video Games')

plt.ylabel('Liters of Ice Cream Consumed Per Week')

plt.show()

吴裕雄 python 机器学习-KNN(2)的更多相关文章
- 吴裕雄 python 机器学习——KNN回归KNeighborsRegressor模型
import numpy as np import matplotlib.pyplot as plt from sklearn import neighbors, datasets from skle ...
- 吴裕雄 python 机器学习——KNN分类KNeighborsClassifier模型
import numpy as np import matplotlib.pyplot as plt from sklearn import neighbors, datasets from skle ...
- 吴裕雄 python 机器学习-KNN算法(1)
import numpy as np import operator as op from os import listdir def classify0(inX, dataSet, labels, ...
- 吴裕雄 python 机器学习——半监督学习LabelSpreading模型
import numpy as np import matplotlib.pyplot as plt from sklearn import metrics from sklearn import d ...
- 吴裕雄 python 机器学习——半监督学习标准迭代式标记传播算法LabelPropagation模型
import numpy as np import matplotlib.pyplot as plt from sklearn import metrics from sklearn import d ...
- 吴裕雄 python 机器学习——分类决策树模型
import numpy as np import matplotlib.pyplot as plt from sklearn import datasets from sklearn.model_s ...
- 吴裕雄 python 机器学习——回归决策树模型
import numpy as np import matplotlib.pyplot as plt from sklearn import datasets from sklearn.model_s ...
- 吴裕雄 python 机器学习——线性判断分析LinearDiscriminantAnalysis
import numpy as np import matplotlib.pyplot as plt from matplotlib import cm from mpl_toolkits.mplot ...
- 吴裕雄 python 机器学习——逻辑回归
import numpy as np import matplotlib.pyplot as plt from matplotlib import cm from mpl_toolkits.mplot ...
随机推荐
- 旷视等Oral论文提出GeoNet:基于测地距离的点云分析深度网络
基于网格曲面的几何拓扑信息可以为物体语义分析和几何建模提供较强的线索,但是,如此重要的连接性信息在点云中是缺失的.为此,旷视西雅图研究院首次提出一种全新的深度学习网络,称之为 GeoNet,可建模点云 ...
- Can't use Subversion command line client***Probably the path to Subversion executable is wrong. Fix
新同事要入职,赶紧收拾一下电脑:再使用SVNupdate代码时,显示Nothing to show.androidstudio不能使用svn了: 是这样婶滴,报错信息 什么情况: 好了:问题叙述完毕开 ...
- nvm use 指定版本后无效 win7
如图所示,nvm install 6.12.3之后,使用命令nvm use 6.12.3,提示切换成功,但是执行node app.js时,报错没有node命令,执行nvm ls查看,发现没有任何版本是 ...
- vue 整合element-ui
本文主要介绍如何在vue框架中结合elementUI. 本文主要参考: http://element-cn.eleme.io/#/zh-CN/component/quickstart 1.阅读本文 ...
- .netLinq动态Where条件
文章介绍全网最佳方式使用EF+Linq实现多条件组合查询:代码中没有使用到网上主流自定义Expression表达式而是采用linq原生态功能编写示例直观.易懂,且有效解决自定义Expression不支 ...
- iOS关于md5 32位加密
导入头文件: #import <CommonCrypto/CommonDigest.h> //md5 32位 加密 (小写)- (NSString *)md5:(NSString *)st ...
- 以虎嗅网4W+文章的文本挖掘为例,展现数据分析的一整套流程
本文转自知乎 作者:苏格兰折耳喵 ----------------------------------------------------- 本文作者将结合自身经验,并以实际案例的形式进行呈现,涉及从 ...
- WebForm多页面传值跳转
一.URL传值 URL传值是利用跳转地址直接加变量定义内容 格式:跳转地址?任意变量=传的值--?=之间不能有空格 多条数据传值 在地址栏继续拼接&key=value void Button1 ...
- MFC相关函数汇总(持续汇总跟新中)
最近有一项关于MFC的任务,做完后总结了一些使用的函数,希望对大家有帮助,也是怕自己忘了所以就写了这篇博客,方便后续的工作. 1,FindWindow() 获得窗口句柄: 2,GetWindowRec ...
- 使用cuteFTP与虚拟机交互文件---安装ftp服务
安装ftp服务,以便在Windows中使用cuteFTP与虚拟机交互文件,使用sudo apt-get install vsftpd 安装完后,打开/etc/vsftpd.conf文件,去掉local ...