mysqld_exporter监控mysql信息
mysqld_exporter监控mysql信息
一、背景
使用 mysqld_exporter 来抓取 mysql的一些指标信息。
二、prometheus接入mysqld_exporter
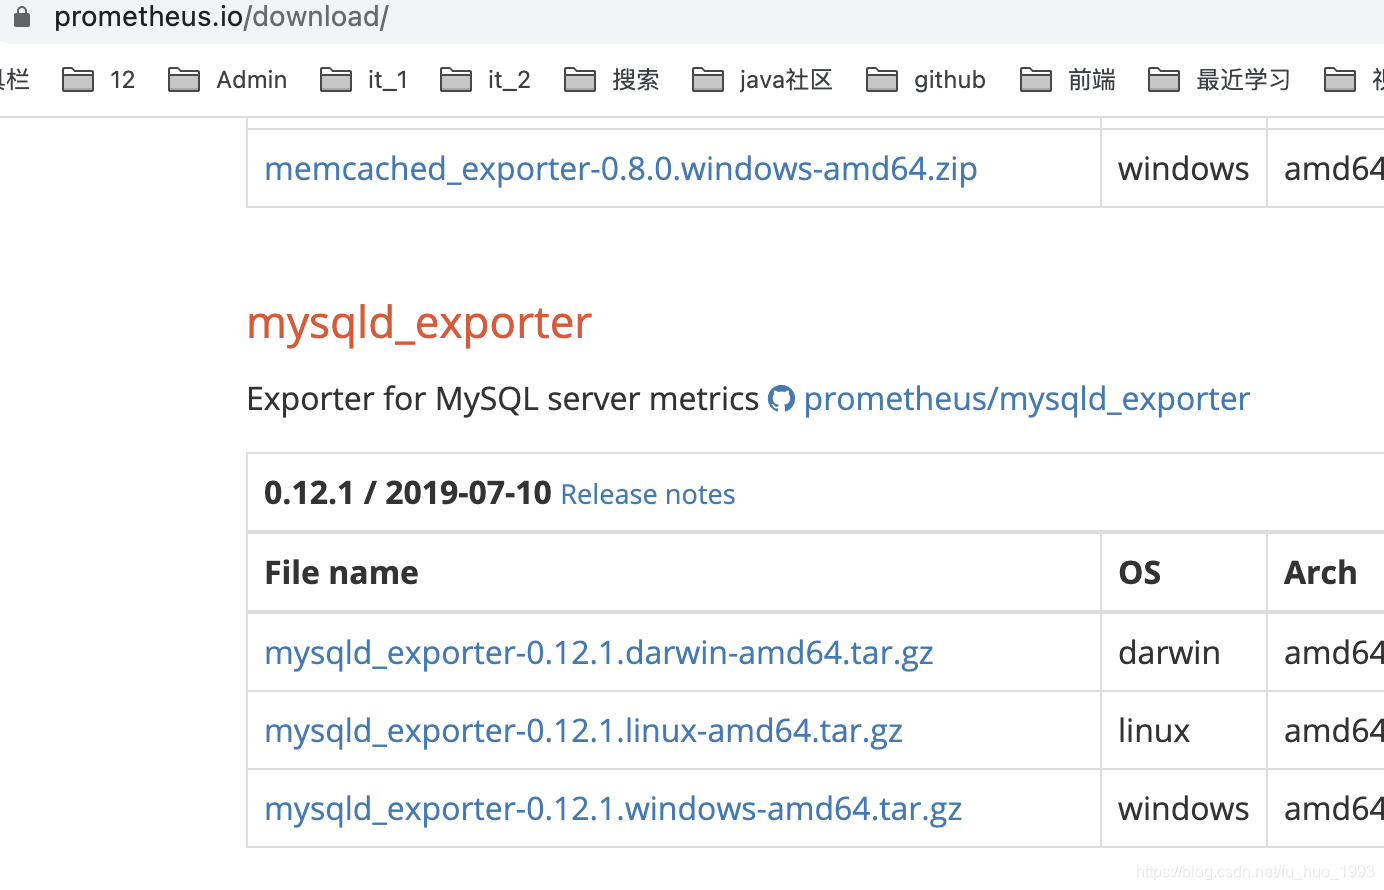
1、安装mysqld_exporter
# 下载 mysqld_exporter

wget https://github.com/prometheus/mysqld_exporter/releases/download/v0.12.1/mysqld_exporter-0.12.1.darwin-amd64.tar.gz

# 解压 并 重命名

tar -zxvf mysqld_exporter-0.12.1.darwin-amd64.tar.gz

mv mysqld_exporter-0.12.1.darwin-amd64 mysqld_exporter
2、创建mysqld_exporter用户并授权
CREATE USER 'mysqld_exporter'@'localhost' IDENTIFIED BY 'mysqldExporter1993' WITH MAX_USER_CONNECTIONS 3;

GRANT PROCESS, REPLICATION CLIENT, SELECT ON *.* TO 'mysqld_exporter'@'localhost';
注意:
在创建用户的时候,推荐执行 MAX_USER_CONNECTIONS参数,避免我们监控使用过多的数据库连接数,导致数据库压力过大。
3、创建 my.cnf 配置文件
在和mysqld_exporter文件同级的文件夹中创建my.cnf文件,文件内容如下。
[client]

user=mysqld_exporter

password=mysqldExporter1993

host=localhost

port=3306
4、启动mysqld_exporter
nohup /Users/huan/soft/prometheus/mysqld_exporter/mysqld_exporter \

--config.my-cnf="/Users/huan/soft/prometheus/mysqld_exporter/my.cnf" \

--web.listen-address="0.0.0.0:9088" \

--log.level=debug \

> logs/mysqld_exporter.out 2>&1 &
参数解释:
| 参数 | 解释 |
|---|---|
| –config.config.my-cnf | 指定配置文件的路径 |
| –web.listen-address | 指定监听的地址,端口 |
| –log.level | 指定日志级别 |
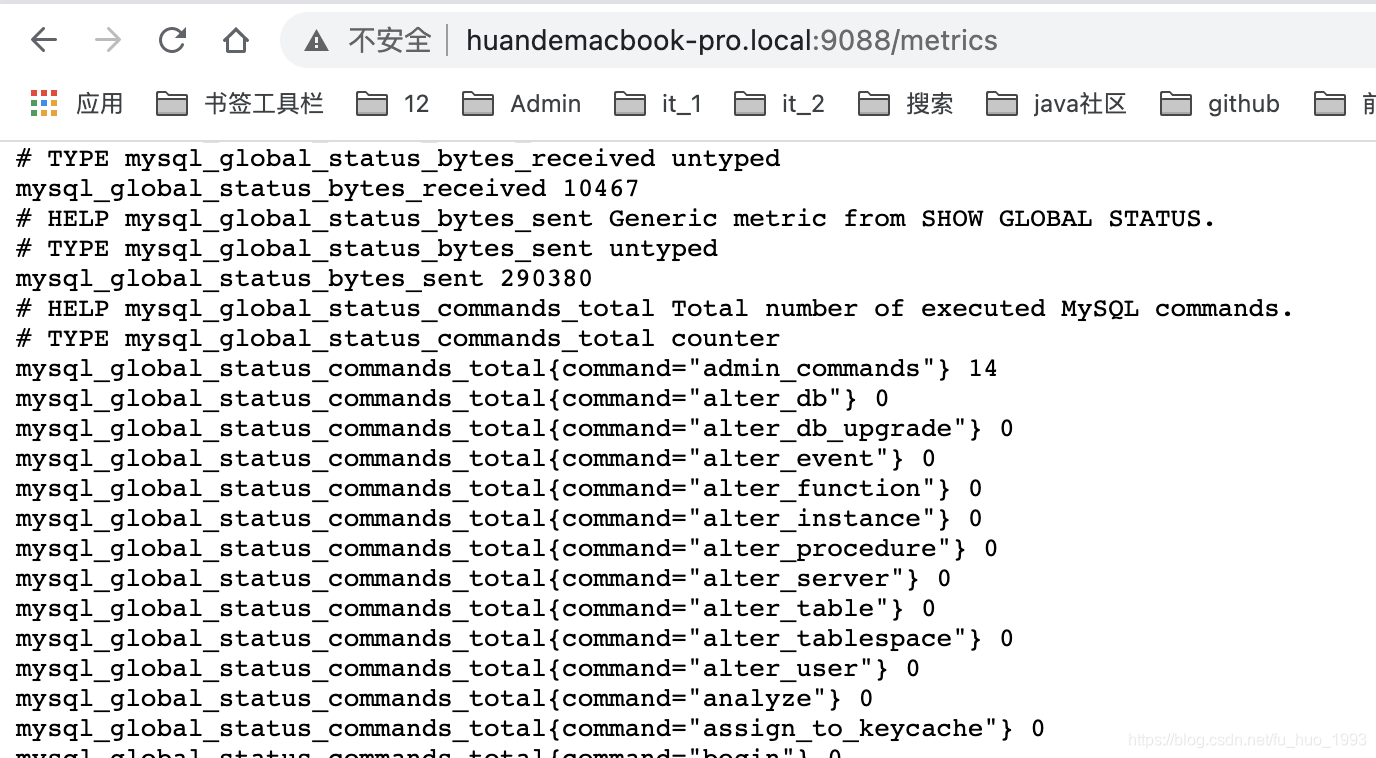
5、查看抓取的mysql指标信息
http://localhost:9088/metrics
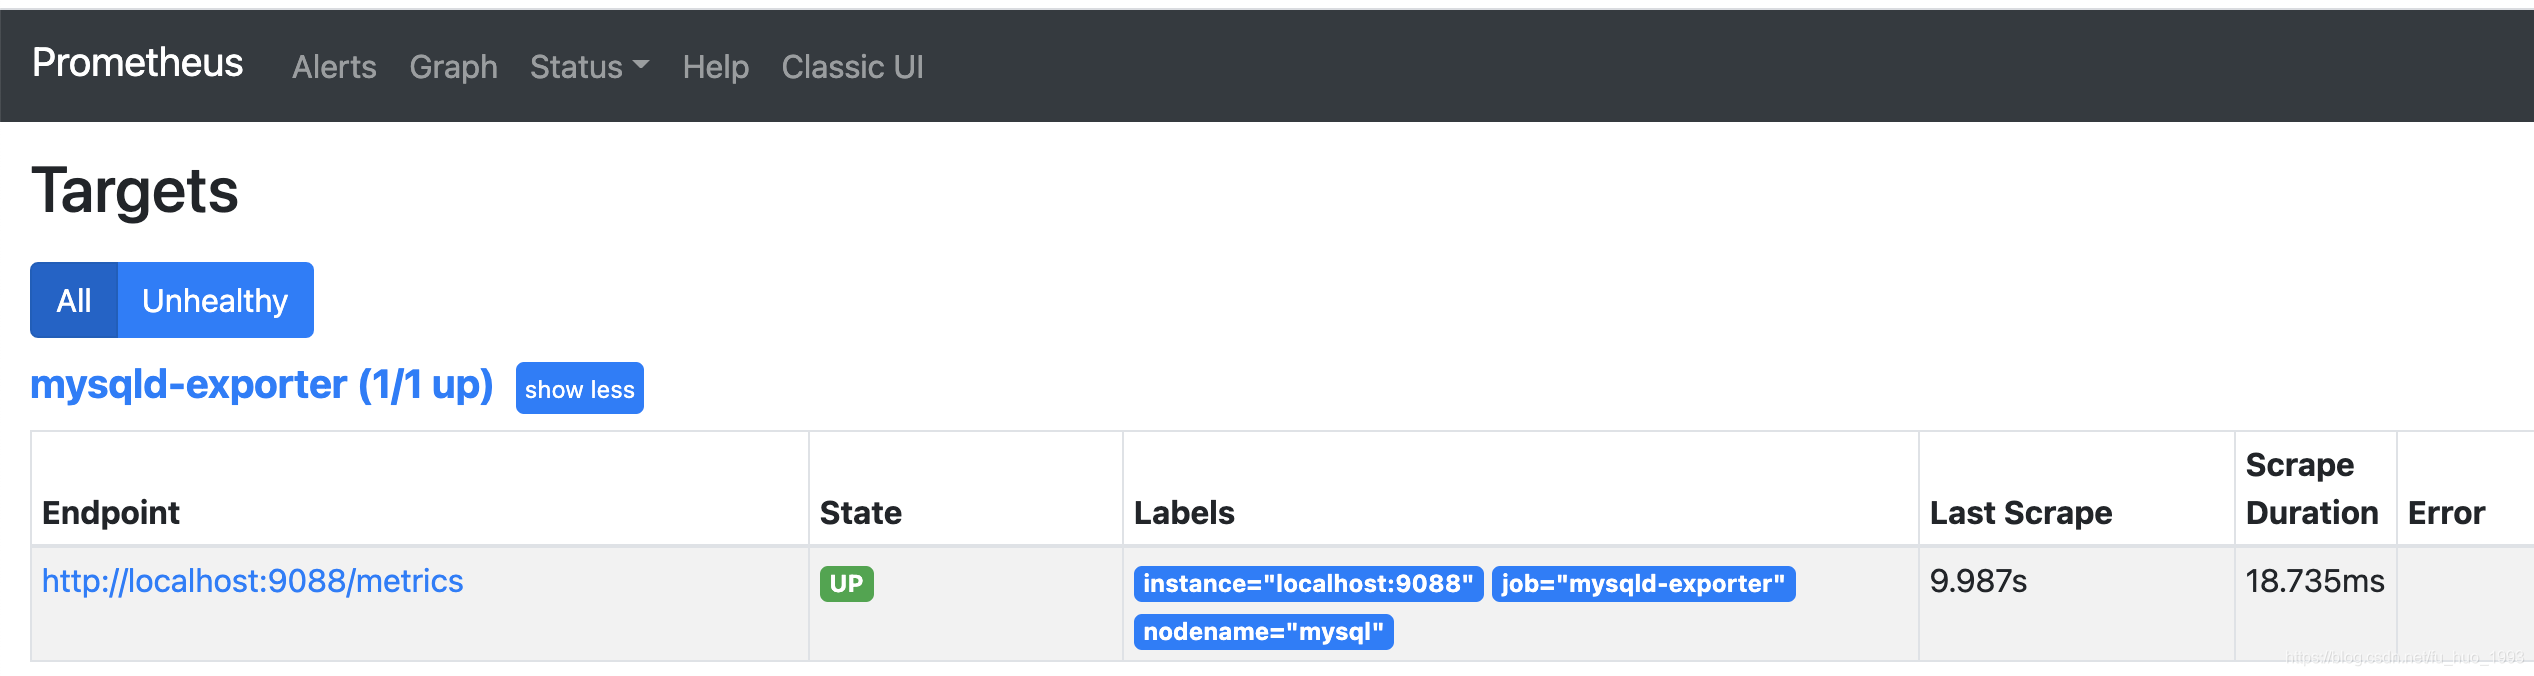
6、接入到prometheus中
scrape_configs:

  - job_name: 'mysqld-exporter'

    static_configs:

    - targets: ['localhost:9088']

      labels:

        nodename: 'mysql'
三、部分告警指标
groups:

- name: GaleraAlerts

  rules:

  - alert: MySQLGaleraNotReady

    expr: mysql_global_status_wsrep_ready != 1

    for: 5m

    labels:

      severity: warning

    annotations:

      description: '{{$labels.job}} on {{$labels.instance}} is not ready.'

      summary: Galera cluster node not ready

  - alert: MySQLGaleraOutOfSync

    expr: (mysql_global_status_wsrep_local_state != 4 and mysql_global_variables_wsrep_desync

      == 0)

    for: 5m

    labels:

      severity: warning

    annotations:

      description: '{{$labels.job}} on {{$labels.instance}} is not in sync ({{$value}}

        != 4).'

      summary: Galera cluster node out of sync

  - alert: MySQLGaleraDonorFallingBehind

    expr: (mysql_global_status_wsrep_local_state == 2 and mysql_global_status_wsrep_local_recv_queue

      > 100)

    for: 5m

    labels:

      severity: warning

    annotations:

      description: '{{$labels.job}} on {{$labels.instance}} is a donor (hotbackup)

        and is falling behind (queue size {{$value}}).'

      summary: xtradb cluster donor node falling behind

  - alert: MySQLReplicationNotRunning

    expr: mysql_slave_status_slave_io_running == 0 or mysql_slave_status_slave_sql_running

      == 0

    for: 2m

    labels:

      severity: critical

    annotations:

      description: Slave replication (IO or SQL) has been down for more than 2 minutes.

      summary: Slave replication is not running

  - alert: MySQLReplicationLag

    expr: (instance:mysql_slave_lag_seconds > 30) and on(instance) (predict_linear(instance:mysql_slave_lag_seconds[5m],

      60 * 2) > 0)

    for: 1m

    labels:

      severity: critical

    annotations:

      description: The mysql slave replication has fallen behind and is not recovering

      summary: MySQL slave replication is lagging

  - alert: MySQLReplicationLag

    expr: (instance:mysql_heartbeat_lag_seconds > 30) and on(instance) (predict_linear(instance:mysql_heartbeat_lag_seconds[5m],

      60 * 2) > 0)

    for: 1m

    labels:

      severity: critical

    annotations:

      description: The mysql slave replication has fallen behind and is not recovering

      summary: MySQL slave replication is lagging

  - alert: MySQLInnoDBLogWaits

    expr: rate(mysql_global_status_innodb_log_waits[15m]) > 10

    labels:

      severity: warning

    annotations:

      description: The innodb logs are waiting for disk at a rate of {{$value}} /

        second

      summary: MySQL innodb log writes stalling
参考连接:https://github.com/prometheus/mysqld_exporter/blob/master/mysqld-mixin/alerts/galera.yaml
四、参考链接
1、mysqld_exporter的github地址
2、mysql的部分告警编写
mysqld_exporter监控mysql信息的更多相关文章
- Grafan+Prometheus 监控 MySQL
架构图 环境 IP 环境 需装软件 192.168.0.237 mysql-5.7.20 node_exporter-0.15.2.linux-amd64.tar.gz mysqld_exporter ...
- 使用Prometheus+Grafana监控MySQL实践
一.介绍Prometheus Prometheus(普罗米修斯)是一套开源的监控&报警&时间序列数据库的组合,起始是由SoundCloud公司开发的.随着发展,越来越多公司和组织接受采 ...
- 采用prometheus 监控mysql
1. prometheus 是什么 开源的系统监控和报警工具,监控项目的流量.内存量.负载量等实时数据. 它通过直接或短时jobs中介收集监控数据,在本地存储所有收集到的数据,并且通过定义好的rule ...
- Grafana+Prometheus 监控 MySQL
转自:Grafana+Prometheus 监控 MySQL 架构图 环境 IP 环境 需装软件 192.168.0.237 mysql-5.7.20 node_exporter-0.15.2.lin ...
- Prometheus 监控Mysql服务器及Grafana可视化
Prometheus 监控Mysql服务器及Grafana可视化. mysql_exporter:用于收集MySQL性能信息. 使用版本 mysqld_exporter 0.11.0 官方地址 使用文 ...
- Prometheus 监控MySQL
目录 0.简介 1.mysql_exporter部署 2.mysql报警规则 0.简介 文中主要监控MySQL/MySQL主从信息 版本:mysql-5.7,mysql_exporter-0.12.1 ...
- mysqld_exporter的源码分析和定制化(单个mysqld_exporter监控多个数据库实例)
mysqld_exporter是prometheus官方提供的用于监控mysql运行状态的exporter.其相关信息可以参考:https://github.com/prometheus/mysqld ...
- 【DB宝41】监控利器PMM的使用--监控MySQL、PG、MongoDB、ProxySQL等
目录 一.PMM简介 二.安装使用 三.监控MySQL数据库 MySQL慢查询分析 四.监控PG数据库 五.监控MongoDB数据库 六.监控ProxySQL中间件 一.PMM简介 之前发布过一篇Pr ...
- 【Prometheus+Grafana系列】监控MySQL服务
前言 前面的一篇文章已经介绍了 docker-compose 搭建 Prometheus + Grafana 服务.当时实现了监控服务器指标数据,是通过 node_exporter.Prometheu ...
随机推荐
- Postman调试Abp API
在swagger中查看登录需要用post方式访问,Abp需要用application/json方式调用 请求体 Postman调用方式 例:访问所有用户,调用Api地址为http://localhos ...
- msf宏钓鱼
kali下载python脚本,生成rtf文件: 下载脚本:git clone https://github.com/bhdresh/CVE-2017-8759.git 生成rtf文件: python ...
- windows中对文件进行排序
右键->排序方式->更多->选择需要的项目
- js根据日期获取所在周
一.获取时间所在周的周一.周五 function getFirstLastDay (time) { let date = new Date(time) let Time = date.getTime( ...
- DFS模板
DFS模板 题型分类:我们可以将DFS题分为两大类: 1 . 地图型:这种题型将地图输入,要求完成一定的任务.因为地图的存在.使得题意清楚形象化,容易理清搜索思路.AOJ 869-迷宫(遍历地图,四向 ...
- 1004. 最大连续1的个数 III
1004. 最大连续1的个数 III 给定一个由若干 0 和 1 组成的数组 A,我们最多可以将 K 个值从 0 变成 1 . 返回仅包含 1 的最长(连续)子数组的长度. 示例 1: 输入:A = ...
- 垃圾分类app--NABCD--团队项目需求与分析
我们的产品是--智能垃圾分类APP,它的设计灵感的来自于"可持续化发展战略,走绿色发展道路",众所周知,垃圾是放错了地方的资源,因此我们团队为了响应国家"垃圾分类&quo ...
- 【PHP数据结构】插入类排序:简单插入、希尔排序
总算进入我们的排序相关算法的学习了.相信不管是系统学习过的还是没有系统学习过算法的朋友都会听说过许多非常出名的排序算法,当然,我们今天入门的内容并不是直接先从最常见的那个算法说起,而是按照一定的规则一 ...
- 网页兼容最新IE声明meta方法
第三种,总是使用最新版本文档模式. 以下是例子: <meta http-equiv="X-UA-Compatible" content="IE=edge" ...
- 带你掌握Vue过滤器filters及时间戳转换
摘要:Vue的filters过滤器是比较常见的一个知识点,下面我将结合时间戳转换的例子带你快速了解filters的用法. 本文分享自华为云社区<三分钟掌握Vue过滤器filters及时间戳转换& ...