《DSP using MATLAB》 示例 Example 9.12

代码:
%% ------------------------------------------------------------------------

%%            Output Info about this m-file

fprintf('\n***********************************************************\n');

fprintf('        <DSP using MATLAB> Exameple 9.12 \n\n');

time_stamp = datestr(now, 31);

[wkd1, wkd2] = weekday(today, 'long');

fprintf('      Now is %20s, and it is %7s  \n\n', time_stamp, wkd2);

%% ------------------------------------------------------------------------

% Given Parameters:

D = 2; Rp = 0.1; As = 30; wp = pi/D; ws = wp+0.1*pi;

% Filter Design:

[delta1, delta2] = db2delta(Rp, As);

[N, F, A, weights] = firpmord([wp, ws]/pi, [1, 0], [delta1, delta2], 2);

h = firpm(N, F, A, weights);

delay = N/2;                        % delay imparted by the filter

%% -----------------------------------------------------------------

%%                             Plot

%% -----------------------------------------------------------------

% Input signal x1(n) = cos(2*pi*n/16)

n = [0:256]; x = cos(pi*n/8);

n1 = n(1:33); x1 = x(33:65);            % for plotting purposes

Hf1 = figure('units', 'inches', 'position', [1, 1, 8, 6], ...

	'paperunits', 'inches', 'paperposition', [0, 0, 6, 4], ...

	'NumberTitle', 'off', 'Name', 'Exameple 9.12');

set(gcf,'Color','white');

TF = 10;

subplot(2, 2, 1);

Hs1 = stem(n1, x1, 'filled'); set(Hs1, 'markersize', 2, 'color', 'g');

axis([-2, 34, -1.2, 1.2]); grid on;

xlabel('n', 'vertical', 'middle'); ylabel('Amplitude');

title('Input Singal: x1(n) = cos(\pin/8) ', 'fontsize', TF, 'vertical', 'baseline');

set(gca, 'xtick', [0:8:32]);

set(gca, 'ytick', [-1, 0, 1]);

% Decimation of x1(n): D = 2

y = upfirdn(x, h, 1, D);

m = delay+1:1:128/D+delay+1; y = y(m); m = 0:16; y = y(16:32);

subplot(2, 2, 3);

Hs2 = stem(m, y, 'filled'); set(Hs2, 'markersize', 2, 'color', 'm');

axis([-1, 17, -1.2, 1.2]); grid on;

xlabel('m', 'vertical', 'middle'); ylabel('Amplitude', 'vertical', 'cap');

title('Output Singal: y1(n): D=2', 'fontsize', TF, 'vertical', 'baseline');

set(gca, 'xtick', [0:8:32]/D);

set(gca, 'ytick', [-1, 0, 1]);

% Input signal x2(n) = cos(8*pi*n/16)

n = [0:256]; x = cos(8*pi*n/(16));

n2 = n(1:33); x2 = x(33:65);            % for plotting purposes

subplot(2, 2, 2);

Hs3 = stem(n2, x2, 'filled'); set(Hs3, 'markersize', 2, 'color', 'g');

axis([-2, 34, -1.2, 1.2]); grid on;

xlabel('n', 'vertical', 'middle'); ylabel('Amplitude', 'vertical', 'cap');

title('Input Singal: x2(n)=cos(\pin/2) ', 'fontsize', TF, 'vertical', 'baseline');

set(gca, 'xtick', [0:8:32]);

set(gca, 'ytick', [-1, 0, 1]);

% Decimation of x2(n): D = 2

y = upfirdn(x, [h], 1, D);           % y = downsample(conv(x,h),2);

m = delay+1:1:128/D+delay+1; y = y(m); m = 0:16; y = y(16:32);

subplot(2, 2, 4);

Hs4 = stem(m, y, 'filled'); set(Hs4, 'markersize', 2, 'color', 'm');

axis([-1, 17, -1.2, 1.2]); grid on;

xlabel('m', 'vertical', 'middle'); ylabel('Amplitude', 'vertical', 'cap');

title('Output Singal: y2(n): D=2', 'fontsize', TF, 'vertical', 'baseline');

set(gca, 'xtick', [0:8:32]/D);

set(gca, 'ytick', [-1, 0, 1]);
运行结果:
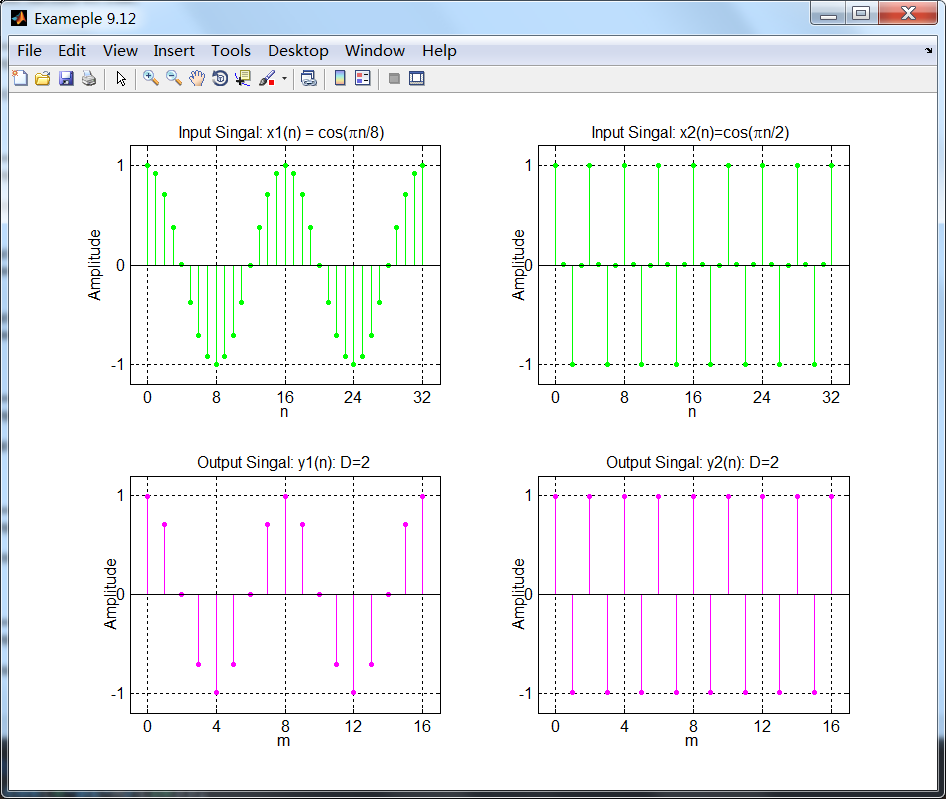
左半边的图展示了x1(n)和相应减采样结果信号y1(n),右半边展示了x2(n)和相应减采样y2(n)。两种情况下减采样
看上去都正确。如果我们选π/2以上的任何频率,那么滤波器将会衰减或消除信号。
《DSP using MATLAB》 示例 Example 9.12的更多相关文章
- 《DSP using MATLAB》Problem 7.12
阻带衰减50dB,我们选Hamming窗 代码: %% ++++++++++++++++++++++++++++++++++++++++++++++++++++++++++++++++++++++++ ...
- 《DSP using MATLAB》Problem 6.12
代码: %% ++++++++++++++++++++++++++++++++++++++++++++++++++++++++++++++++++++++++++++++++ %% Output In ...
- 《DSP using MATLAB》Problem 5.12
1.从别的地方找的证明过程: 2.代码 function x2 = circfold(x1, N) %% Circular folding using DFT %% ----------------- ...
- 《DSP using MATLAB》Problem 8.12
代码: %% ------------------------------------------------------------------------ %% Output Info about ...
- DSP using MATLAB 示例 Example3.12
用到的性质 代码: n = -5:10; x = sin(pi*n/2); k = -100:100; w = (pi/100)*k; % freqency between -pi and +pi , ...
- DSP using MATLAB 示例Example2.12
代码: b = [1]; a = [1, -0.9]; n = [-5:50]; h = impz(b,a,n); set(gcf,'Color','white'); %subplot(2,1,1); ...
- DSP using MATLAB 示例Example3.21
代码: % Discrete-time Signal x1(n) % Ts = 0.0002; n = -25:1:25; nTs = n*Ts; Fs = 1/Ts; x = exp(-1000*a ...
- DSP using MATLAB 示例 Example3.19
代码: % Analog Signal Dt = 0.00005; t = -0.005:Dt:0.005; xa = exp(-1000*abs(t)); % Discrete-time Signa ...
- DSP using MATLAB示例Example3.18
代码: % Analog Signal Dt = 0.00005; t = -0.005:Dt:0.005; xa = exp(-1000*abs(t)); % Continuous-time Fou ...
- DSP using MATLAB 示例 Example3.11
用到的性质 上代码: n = -5:10; x = rand(1,length(n)); k = -100:100; w = (pi/100)*k; % freqency between -pi an ...
随机推荐
- VS2010/MFC编程入门之二十八(常用控件:列表视图控件List Control 上)
前面一节中,鸡啄米讲了图片控件Picture Control,本节为大家详解列表视图控件List Control的使用. 列表视图控件简介 列表视图控件List Control同样比较常见, ...
- uva672
Gangsters N gangsters are going to a restaurant. The i-th gangster comes at the time Ti and has t ...
- Python3.x:自动生成IP写入文本
Python3.x:自动生成IP写入文本 ''' 生成ip写入文件 ''' import time time_start = time.time() #参数:number-生成条数:start-开始i ...
- 一个免费ss网站的数据爬取过程
一个免费ss网站的数据爬取过程 Apr 14, 2019 引言 爬虫整体概况 主要功能方法 绕过DDOS保护(Cloudflare) post中参数a,b,c的解析 post中参数a,b,c的解析 p ...
- BZOJ2221: [Jsoi2009]面试的考验
传送门 一句话题意,给定一个序列,询问区间内差值的绝对值的最小值. 这道题之前见过一次,似乎是在一次UER上,那一道题当时是用了近似算法才能过. 数据保证数列随机. 这道题显然非常适合离线的做法,考虑 ...
- awk根据指定的字符串分割字符串
以从字符串"hello-kitty-red-for-you"中获取-for前面的内容为例: echo "hello-kitty-red-for-you" |aw ...
- [kata]数值内3和5的倍数的总和求解
这个题是这样的,方法参数接受一个数值,以3,5为基数,返回小于这个参数的3,5的倍数,加上3,5本身总和. 朋友段帅说头疼,估计是天气原因吧,好起来吧,还得战斗呢.
- nginx.conf 配置详解
目录 pid user error_log worker_connections include http server nginx主配置文件中的内容 pid 主线程id的存储位置. # cat /u ...
- Android静态变量的生命周期
Android是用Java开发,其静态变量的生命周期遵守Java的设计.我们知道静态变量是在类被load的时候分配内存的,并且存在于方法区.当类 被卸载的时候,静态变量被销毁.在PC机的客户端程序中, ...
- npm汇总:npm命令 + 实用插件
一.npm常用命令,以便查阅: npm install //运行npm install可根据package.json的配置自动安装所有依赖包 npm uninstall //卸载依赖,如n ...