
《DSP using MATLAB》Problem 8.21
代码:
%% ------------------------------------------------------------------------

%%            Output Info about this m-file

fprintf('\n***********************************************************\n');

fprintf('        <DSP using MATLAB> Problem 8.21 \n\n');

banner();

%% ------------------------------------------------------------------------

Fp = 3.2;                    % analog passband freq in kHz

Fs = 3.8;                    % analog stopband freq in kHz

fs = 8;                      % sampling rate in kHz

% -------------------------------

%       ω = ΩT = 2πF/fs

% Digital Filter Specifications:

% -------------------------------

%wp = 2*pi*Fp/fs;                 % digital passband freq in rad/sec

wp = Fp;

%ws = 2*pi*Fs/fs;                 % digital stopband freq in rad/sec

ws = Fs;

Rp = 0.5;                        % passband ripple in dB

As = 45;                         % stopband attenuation in dB

Ripple = 10 ^ (-Rp/20)           % passband ripple in absolute

Attn = 10 ^ (-As/20)             % stopband attenuation in absolute

% Analog prototype specifications: Inverse Mapping for frequencies

T = 1;                       % set T = 1

OmegaP = wp/T;               % prototype passband freq

OmegaS = ws/T;               % prototype stopband freq

% Analog Chebyshev-1 Prototype Filter Calculation:

[cs, ds] = afd_chb1(OmegaP, OmegaS, Rp, As);

% Calculation of second-order sections:

fprintf('\n***** Cascade-form in s-plane: START *****\n');

[CS, BS, AS] = sdir2cas(cs, ds)

fprintf('\n***** Cascade-form in s-plane: END *****\n');

% Calculation of Frequency Response:

[db_s, mag_s, pha_s, ww_s] = freqs_m(cs, ds, 8);

% Calculation of Impulse Response:

[ha, x, t] = impulse(cs, ds);

% Impulse Invariance Transformation:

[b, a] = imp_invr(cs, ds, T); [C, B, A] = dir2par(b, a)

% Calculation of Frequency Response:

[db, mag, pha, grd, ww] = freqz_m(b, a);

%% -----------------------------------------------------------------

%%                             Plot

%% -----------------------------------------------------------------

figure('NumberTitle', 'off', 'Name', 'Problem 8.21 Analog Chebyshev-I lowpass')

set(gcf,'Color','white');

M = 1.0;                          % Omega max

subplot(2,2,1); plot(ww_s, mag_s/T);  grid on; %axis([-10, 10, 0, 1.2]);

xlabel(' Analog frequency in kHz units'); ylabel('|H|'); title('Magnitude in Absolute');

set(gca, 'XTickMode', 'manual', 'XTick', [-8, -3.8, -3.2, 0, 3.2, 3.8, 8]);

set(gca, 'YTickMode', 'manual', 'YTick', [0, 0.006, 0.94, 1]);

subplot(2,2,2); plot(ww_s, db_s);  grid on; %axis([0, M, -50, 10]);

xlabel('Analog frequency in kHz units'); ylabel('Decibels'); title('Magnitude in dB ');

set(gca, 'XTickMode', 'manual', 'XTick', [-8, -3.8, 0, 3.2, 3.8, 8]);

set(gca, 'YTickMode', 'manual', 'YTick', [-45, -1, 0]);

set(gca,'YTickLabelMode','manual','YTickLabel',['45';' 1';' 0']);

subplot(2,2,3); plot(ww_s, pha_s/pi);  grid on; axis([-10, 10, -1.2, 1.2]);

xlabel('Analog frequency in kHz nuits'); ylabel('radians'); title('Phase Response');

set(gca, 'XTickMode', 'manual', 'XTick', [-8, -3.8, 0, 3.2, 3.8, 8]);

set(gca, 'YTickMode', 'manual', 'YTick', [-1:0.5:1]);

subplot(2,2,4); plot(t, ha); grid on; %axis([0, 30, -0.05, 0.25]);

xlabel('time in seconds'); ylabel('ha(t)'); title('Impulse Response');

figure('NumberTitle', 'off', 'Name', 'Problem 8.21 Digital Chebyshev-I lowpass')

set(gcf,'Color','white');

M = 2;                          % Omega max

subplot(2,2,1); plot(ww/pi, mag); axis([0, M, 0, 1.2]); grid on;

xlabel(' frequency in \pi units'); ylabel('|H|'); title('Magnitude Response');

set(gca, 'XTickMode', 'manual', 'XTick', [0, 0.8, 0.95, M]);

set(gca, 'YTickMode', 'manual', 'YTick', [0, 0.0056, 0.9441, 1]);

subplot(2,2,2); plot(ww/pi, pha/pi); axis([0, M, -1.1, 1.1]); grid on;

xlabel('frequency in \pi nuits'); ylabel('radians in \pi units'); title('Phase Response');

set(gca, 'XTickMode', 'manual', 'XTick', [0, 0.8, 0.95, M]);

set(gca, 'YTickMode', 'manual', 'YTick', [-1:1:1]);

subplot(2,2,3); plot(ww/pi, db); axis([0, M, -30, 10]); grid on;

xlabel('frequency in \pi units'); ylabel('Decibels'); title('Magnitude in dB ');

set(gca, 'XTickMode', 'manual', 'XTick', [0, 0.8, 0.95, M]);

set(gca, 'YTickMode', 'manual', 'YTick', [-60, -45, -1, 0]);

set(gca,'YTickLabelMode','manual','YTickLabel',['60';'45';' 1';' 0']);

subplot(2,2,4); plot(ww/pi, grd); grid on; %axis([0, M, 0, 35]);

xlabel('frequency in \pi units'); ylabel('Samples'); title('Group Delay');

set(gca, 'XTickMode', 'manual', 'XTick', [0, 0.8, 0.95, M]);

%set(gca, 'YTickMode', 'manual', 'YTick', [0:5:35]);

figure('NumberTitle', 'off', 'Name', 'Problem 8.21 Pole-Zero Plot')

set(gcf,'Color','white');

zplane(b,a);

title(sprintf('Pole-Zero Plot'));

%pzplotz(b,a);

% ----------------------------------------------

%       Calculation of Impulse Response

% ----------------------------------------------

figure('NumberTitle', 'off', 'Name', 'Problem 8.21 Imp & Freq Response')

set(gcf,'Color','white');

t = [0:0.01:60]; subplot(2,1,1); impulse(cs,ds,t); grid on;   % Impulse response of the analog filter

axis([0,60,-0.5,1.0]);hold on

n = [0:1:60/T]; hn = filter(b,a,impseq(0,0,60/T));           % Impulse response of the digital filter

stem(n*T,hn); xlabel('time in sec'); title (sprintf('Impulse Responses T=%2d',T));

hold off

% Calculation of Frequency Response:

[dbs, mags, phas, wws] = freqs_m(cs, ds, 2*pi/T);             % Analog frequency   s-domain

[dbz, magz, phaz, grdz, wwz] = freqz_m(b, a);                 % Digital  z-domain

%% -----------------------------------------------------------------

%%                             Plot

%% -----------------------------------------------------------------

subplot(2,1,2); plot(wws/(2*pi),mags/T,'b+', wwz/(2*pi*T),magz,'r'); grid on;

xlabel('frequency in Hz'); title('Magnitude Responses'); ylabel('Magnitude');

text(-0.8,0.15,'Analog filter'); text(0.6,1.05,'Digital filter');
运行结果:
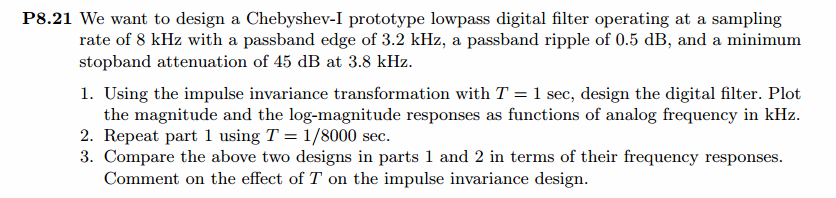
通带、阻带指标
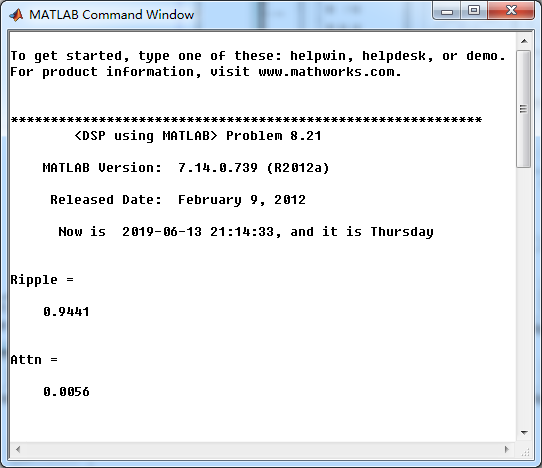
模拟Chebyshev-1型低通系统函数,串联形式系数
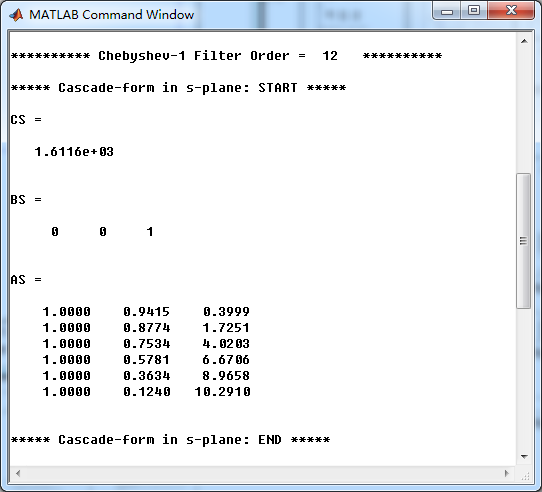
脉冲响应不变法,转换成数字低通,系统函数直接形式系数
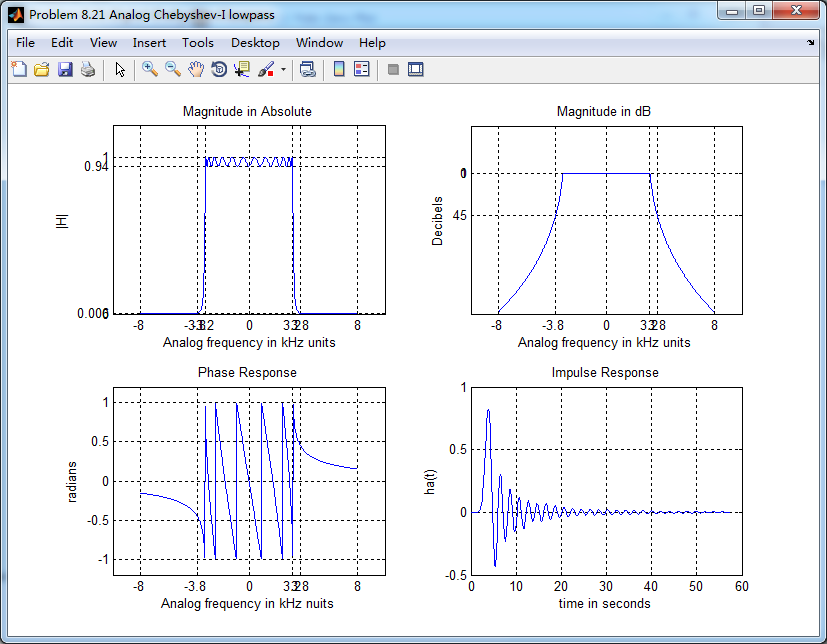
模拟Chebyshev-1型低通,幅度谱、相位谱和脉冲响应
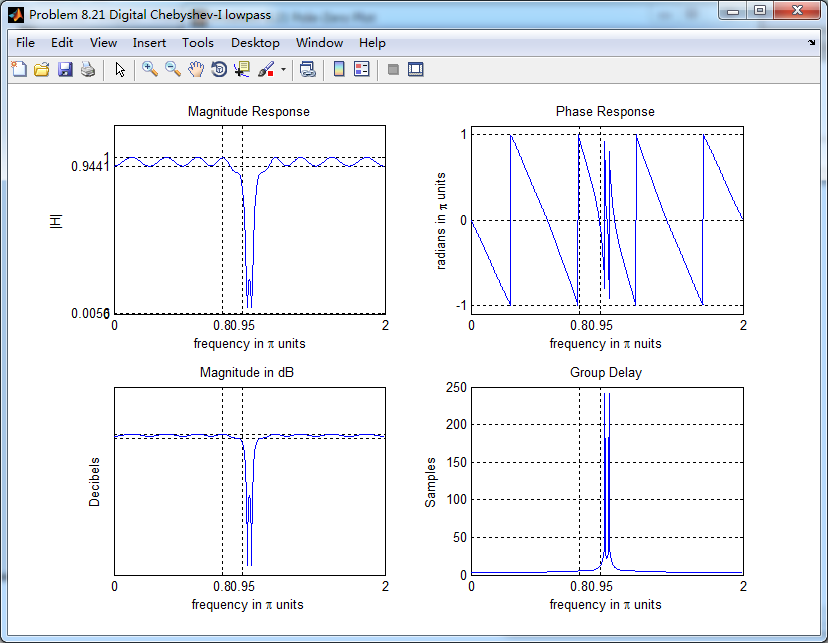
数字Chebyshev-1型低通,幅度谱、相位谱和群延迟
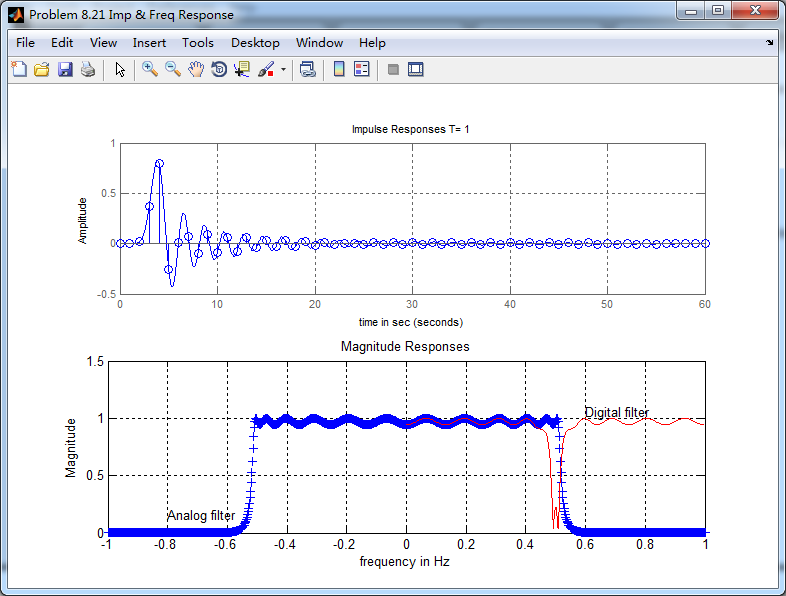
《DSP using MATLAB》Problem 8.21的更多相关文章
- 《DSP using MATLAB》Problem 6.21
代码: %% ++++++++++++++++++++++++++++++++++++++++++++++++++++++++++++++++++++++++++++++++ %% Output In ...
- 《DSP using MATLAB》Problem 5.21
证明: 代码: %% ++++++++++++++++++++++++++++++++++++++++++++++++++++++++++++++++++++++++++++++++++++++++ ...
- 《DSP using MATLAB》Problem 4.21
快到龙抬头,居然下雪了,天空飘起了雪花,温度下降了近20°. 代码: %% -------------------------------------------------------------- ...
- 《DSP using MATLAB》Problem 3.21
模拟信号经过不同的采样率进行采样后,得到不同的数字角频率,如下: 三种Fs,采样后的信号的谱 重建模拟信号,这里只显示由第1种Fs=0.01采样后序列进行重建,采用zoh.foh和spline三种方法 ...
- 《DSP using MATLAB》Problem 7.27
代码: %% ++++++++++++++++++++++++++++++++++++++++++++++++++++++++++++++++++++++++++++++++ %% Output In ...
- 《DSP using MATLAB》Problem 7.26
注意:高通的线性相位FIR滤波器,不能是第2类,所以其长度必须为奇数.这里取M=31,过渡带里采样值抄书上的. 代码: %% +++++++++++++++++++++++++++++++++++++ ...
- 《DSP using MATLAB》Problem 7.24
又到清明时节,…… 注意:带阻滤波器不能用第2类线性相位滤波器实现,我们采用第1类,长度为基数,选M=61 代码: %% +++++++++++++++++++++++++++++++++++++++ ...
- 《DSP using MATLAB》Problem 7.23
%% ++++++++++++++++++++++++++++++++++++++++++++++++++++++++++++++++++++++++++++++++ %% Output Info a ...
- 《DSP using MATLAB》Problem 7.16
使用一种固定窗函数法设计带通滤波器. 代码: %% ++++++++++++++++++++++++++++++++++++++++++++++++++++++++++++++++++++++++++ ...
随机推荐
- 5个Sublime Text 的插件推荐
Sublime Text 是一个代码编辑器(Sublime Text 2是收费软件,但可以无限期试用),也是HTML和散文先进的文本编辑器.Sublime Text是由程序员Jon Skinner于2 ...
- shell 脚本 功能性语句 read,expr,test
1. read 从终端输入数据赋值给变量 read val 把读入的数据存放到val中 #!/bin/bash echo -n "please input two number :" ...
- JQUERY(入口函数 选择器)
入口函数 $(document).ready(function(){ });可以简写为$(function(){}) 选择器 基本选择器 元素选择器 $("p") 所有 & ...
- SQL Server SQLFetch()
{ /* 摘要 SQLFetch从结果集中提取下一个数据行集, 并返回所有绑定列的数据. 语法 C++ SQLRETURN SQLFetch( SQLHSTMT StatementHandle ...
- 阿里第一颗芯片问世,平头哥发布最强AI芯片含光800
阿里巴巴第一颗自研芯片正式问世.9月25日的杭州云栖大会上,达摩院院长张建锋现场展示了这款全球最强的AI芯片——含光800.在业界标准的ResNet-50测试中,含光800推理性能达到78563 IP ...
- Eclipse MyBatis generator 1.3.7插件的核心包(中文注释)
一.最近刚搭建一个项目框架,使用springboot + mybatis,但是在使用Eclipse开发时发现开发mybatis的Dao.mapper.xml和entity时特别不方便,手工去写肯定是不 ...
- iOS开发之SceneKit框架--SCNGeometry.h
1.SCNGeometry简介 SCNGeometry负责呈现三维模型的类,它管理者物体的形状.纹理等.它可以由SCNGeometrySource和SCNGeometryElement来构造, 一个S ...
- QT之QStatusBar
1.QStatusBar一般处于主窗体(QMainWindow)的左下角用于显示比较重要的状态信息.我们通常调用其showMessage()函数 QT官方显示:[slot] void QStatusB ...
- IDA 远程调试设置
第一步,先去 IDA dbgsrv 这个目录下,找到要调试的那个远程计算机对应的可用客户端, 比如,android_server, 把它拷贝到目标计算机中, 比如 adb push .... 然 ...
- linux nload命令简介及安装方法
第一步:nload命令简介 nload 命令用于查看linux网络流量状况,实时输出.可以理解为是一个控制台应用程序,用来实时监测网络流量和带宽使用情况的命令. 使用可视化的界面显示流入和留出系统的网 ...