吴裕雄--天生自然 PYTHON数据分析:糖尿病视网膜病变数据分析(完整版)
# This Python 3 environment comes with many helpful analytics libraries installed

# It is defined by the kaggle/python docker image: https://github.com/kaggle/docker-python

# For example, here's several helpful packages to load in

import numpy as np # linear algebra

import pandas as pd # data processing, CSV file I/O (e.g. pd.read_csv)

# Input data files are available in the "../input/" directory.

# For example, running this (by clicking run or pressing Shift+Enter) will list the files in the input directory
import os, sys

import numpy as np

import pandas as pd

import matplotlib.pyplot as plt

import skimage.io

from skimage.transform import resize

#from imgaug import augmenters as iaa

from tqdm import tqdm

import PIL

from PIL import Image, ImageOps

import cv2

from sklearn.utils import class_weight, shuffle

from keras.losses import binary_crossentropy

from keras.applications.resnet50 import preprocess_input

import keras.backend as K

import tensorflow as tf

from sklearn.metrics import f1_score, fbeta_score

from keras.utils import Sequence

from keras.utils import to_categorical

from sklearn.model_selection import train_test_split

WORKERS = 2

CHANNEL = 3

import warnings

warnings.filterwarnings("ignore")

IMG_SIZE = 512

NUM_CLASSES = 5

SEED = 77

TRAIN_NUM = 1000 # use 1000 when you just want to explore new idea, use -1 for full train
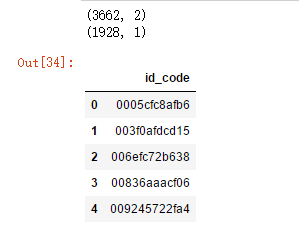
df_train = pd.read_csv('F:\\kaggleDataSet\\diabeticRetinopathy\\trainLabels19.csv')

df_test = pd.read_csv('F:\\kaggleDataSet\\diabeticRetinopathy\\testImages19.csv')

x = df_train['id_code']

y = df_train['diagnosis']

x, y = shuffle(x, y, random_state=SEED)
train_x, valid_x, train_y, valid_y = train_test_split(x, y, test_size=0.15,stratify=y, random_state=SEED)

print(train_x.shape, train_y.shape, valid_x.shape, valid_y.shape)

train_y.hist()

valid_y.hist()

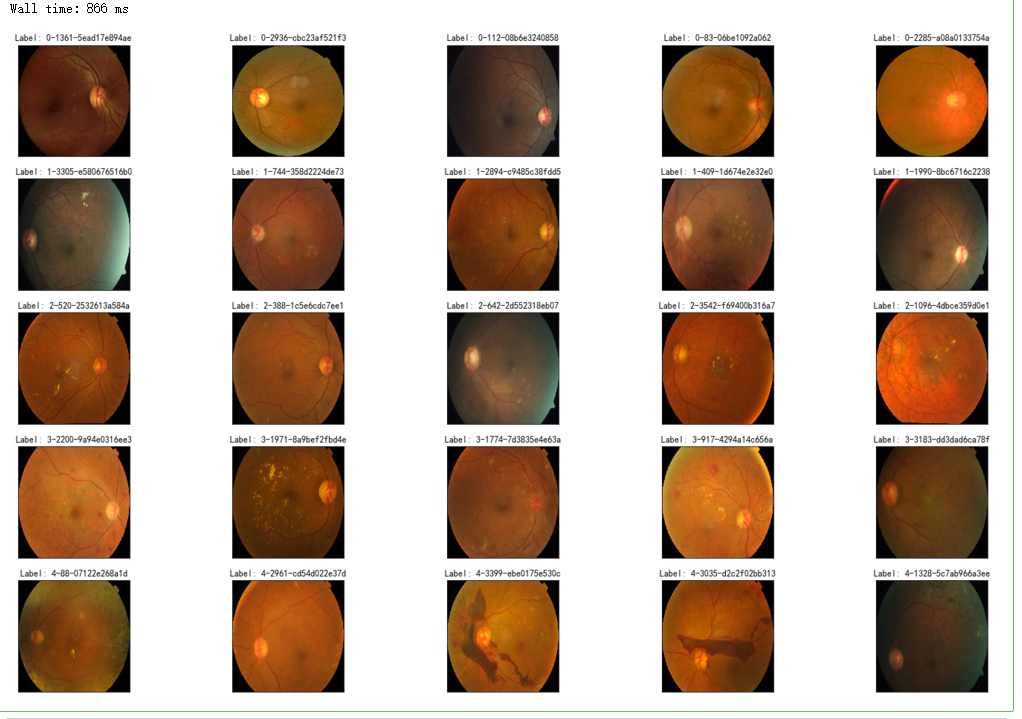
%%time

fig = plt.figure(figsize=(25, 16))

# display 10 images from each class

for class_id in sorted(train_y.unique()):

    for i, (idx, row) in enumerate(df_train.loc[df_train['diagnosis'] == class_id].sample(5, random_state=SEED).iterrows()):

        ax = fig.add_subplot(5, 5, class_id * 5 + i + 1, xticks=[], yticks=[])

        path="F:\\kaggleDataSet\\diabeticRetinopathy\\resized train 19\\"+str(row['id_code'])+".jpg"

        image = cv2.imread(path)

        image = cv2.cvtColor(image, cv2.COLOR_BGR2RGB)

        image = cv2.resize(image, (IMG_SIZE, IMG_SIZE))

        plt.imshow(image)

        ax.set_title('Label: %d-%d-%s' % (class_id, idx, row['id_code']) )
%%time

fig = plt.figure(figsize=(25, 16))

for class_id in sorted(train_y.unique()):

    for i, (idx, row) in enumerate(df_train.loc[df_train['diagnosis'] == class_id].sample(5, random_state=SEED).iterrows()):

        ax = fig.add_subplot(5, 5, class_id * 5 + i + 1, xticks=[], yticks=[])

        path="F:\\kaggleDataSet\\diabeticRetinopathy\\resized train 19\\"+str(row['id_code'])+".jpg"

        image = cv2.imread(path)

        image = cv2.cvtColor(image, cv2.COLOR_BGR2GRAY)

#         image=cv2.addWeighted ( image, 0 , cv2.GaussianBlur( image , (0 ,0 ) , 10) ,-4 ,128)

        image = cv2.resize(image, (IMG_SIZE, IMG_SIZE))

        plt.imshow(image, cmap='gray')

        ax.set_title('Label: %d-%d-%s' % (class_id, idx, row['id_code']) )

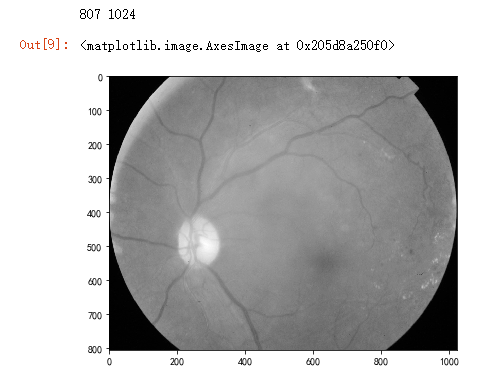
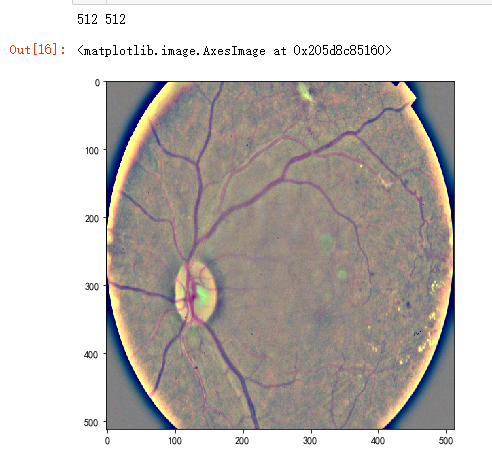
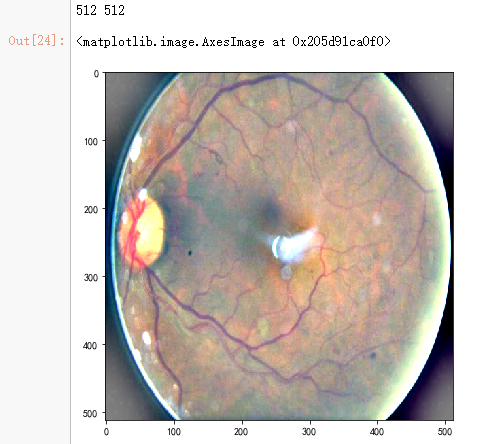
dpi = 80 #inch

# path=f"../input/aptos2019-blindness-detection/train_images/5c7ab966a3ee.png" # notice upper part

path="F:\\kaggleDataSet\\diabeticRetinopathy\\resized train 19\\cd54d022e37d.jpg" # lower-right, this still looks not so severe, can be class3

image = cv2.imread(path)

image = cv2.cvtColor(image, cv2.COLOR_BGR2GRAY)

height, width = image.shape

print(height, width)

SCALE=2

figsize = (width / float(dpi))/SCALE, (height / float(dpi))/SCALE

fig = plt.figure(figsize=figsize)

plt.imshow(image, cmap='gray')
%%time

fig = plt.figure(figsize=(25, 16))

for class_id in sorted(train_y.unique()):

    for i, (idx, row) in enumerate(df_train.loc[df_train['diagnosis'] == class_id].sample(5, random_state=SEED).iterrows()):

        ax = fig.add_subplot(5, 5, class_id * 5 + i + 1, xticks=[], yticks=[])

        path="F:\\kaggleDataSet\\diabeticRetinopathy\\resized train 19\\"+str(row['id_code'])+".jpg"

        image = cv2.imread(path)

        image = cv2.cvtColor(image, cv2.COLOR_BGR2GRAY)

#         image = cv2.cvtColor(image, cv2.COLOR_BGR2RGB)

        image = cv2.resize(image, (IMG_SIZE, IMG_SIZE))

        image=cv2.addWeighted ( image,4, cv2.GaussianBlur( image , (0,0) , IMG_SIZE/10) ,-4 ,128) # the trick is to add this line

        plt.imshow(image, cmap='gray')

        ax.set_title('Label: %d-%d-%s' % (class_id, idx, row['id_code']) )

def crop_image1(img,tol=7):

    # img is image data

    # tol  is tolerance

    mask = img>tol

    return img[np.ix_(mask.any(1),mask.any(0))]

def crop_image_from_gray(img,tol=7):

    if img.ndim ==2:

        mask = img>tol

        return img[np.ix_(mask.any(1),mask.any(0))]

    elif img.ndim==3:

        gray_img = cv2.cvtColor(img, cv2.COLOR_RGB2GRAY)

        mask = gray_img>tol

        check_shape = img[:,:,0][np.ix_(mask.any(1),mask.any(0))].shape[0]

        if (check_shape == 0): # image is too dark so that we crop out everything,

            return img # return original image

        else:

            img1=img[:,:,0][np.ix_(mask.any(1),mask.any(0))]

            img2=img[:,:,1][np.ix_(mask.any(1),mask.any(0))]

            img3=img[:,:,2][np.ix_(mask.any(1),mask.any(0))]

    #         print(img1.shape,img2.shape,img3.shape)

            img = np.stack([img1,img2,img3],axis=-1)

    #         print(img.shape)

        return img
def load_ben_color(path, sigmaX=10):

    image = cv2.imread(path)

    image = cv2.cvtColor(image, cv2.COLOR_BGR2RGB)

    image = crop_image_from_gray(image)

    image = cv2.resize(image, (IMG_SIZE, IMG_SIZE))

    image=cv2.addWeighted ( image,4, cv2.GaussianBlur( image , (0,0) , sigmaX) ,-4 ,128)

    return image
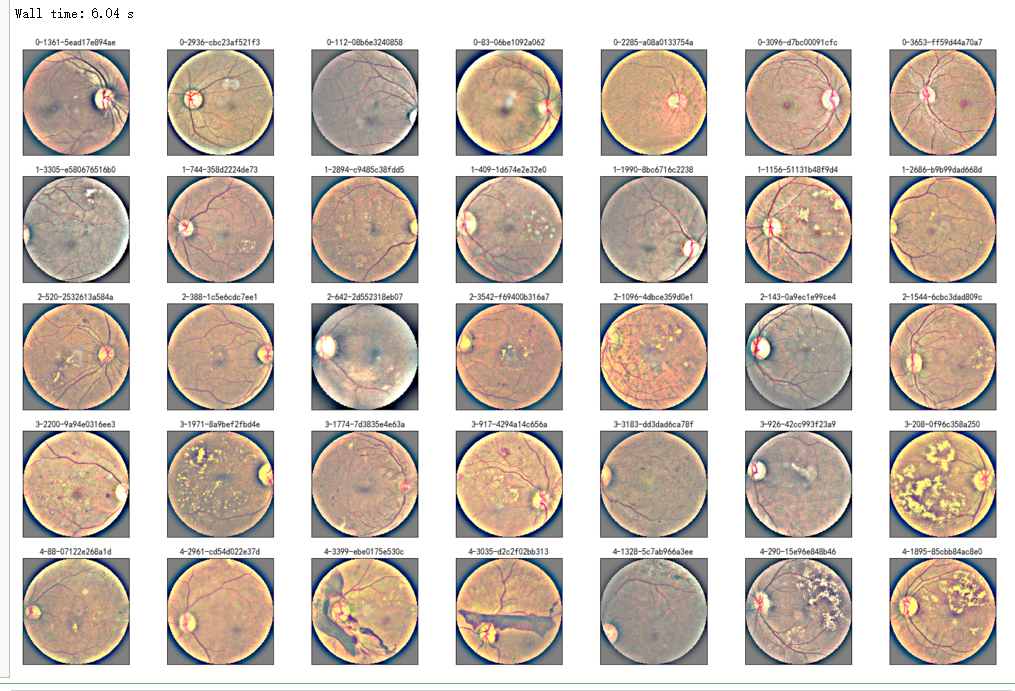
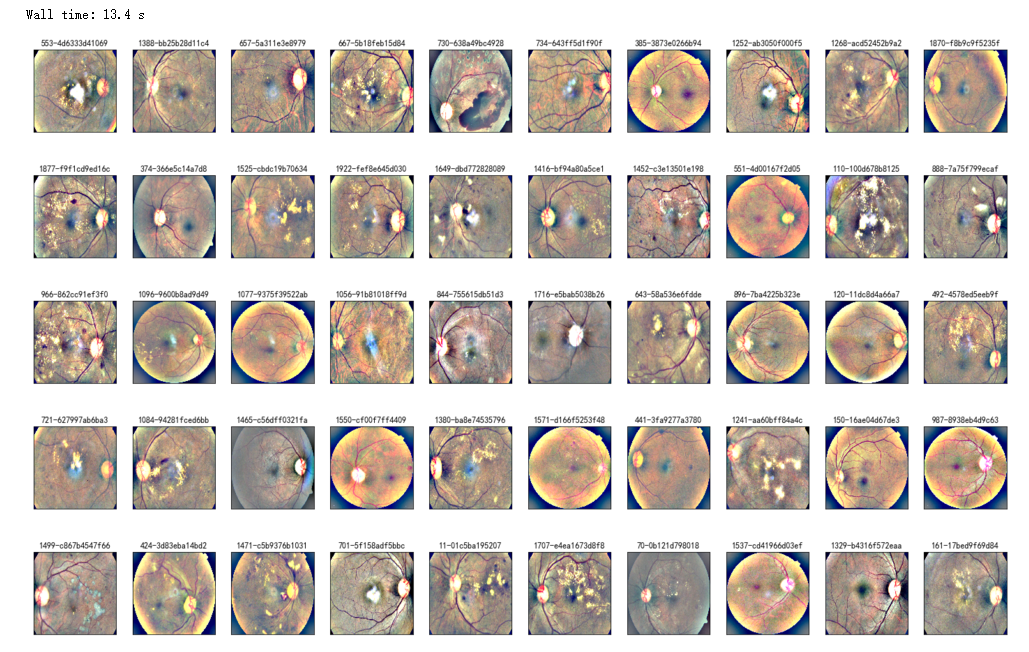
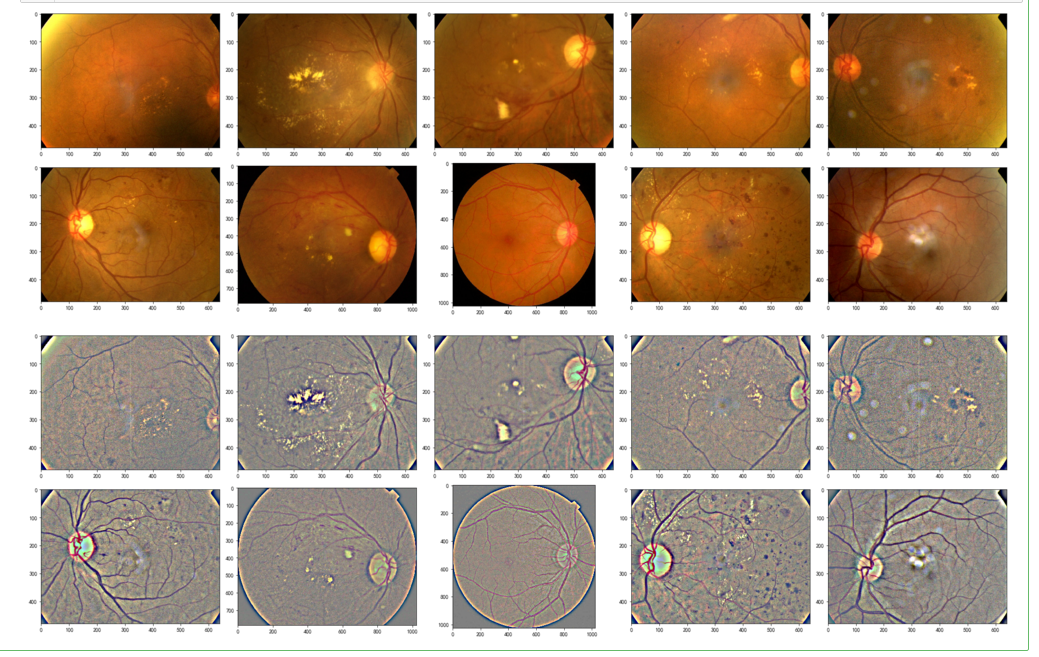
%%time

NUM_SAMP=7

fig = plt.figure(figsize=(25, 16))

for class_id in sorted(train_y.unique()):

    for i, (idx, row) in enumerate(df_train.loc[df_train['diagnosis'] == class_id].sample(NUM_SAMP, random_state=SEED).iterrows()):

        ax = fig.add_subplot(5, NUM_SAMP, class_id * NUM_SAMP + i + 1, xticks=[], yticks=[])

        path="F:\\kaggleDataSet\\diabeticRetinopathy\\resized train 19\\"+str(row['id_code'])+".jpg"

        image = load_ben_color(path,sigmaX=30)

        plt.imshow(image)

        ax.set_title('%d-%d-%s' % (class_id, idx, row['id_code']) )

def circle_crop(img, sigmaX=10):

    """

    Create circular crop around image centre

    """

    img = cv2.imread(img)

    img = crop_image_from_gray(img)

    img = cv2.cvtColor(img, cv2.COLOR_BGR2RGB)

    height, width, depth = img.shape

    x = int(width/2)

    y = int(height/2)

    r = np.amin((x,y))

    circle_img = np.zeros((height, width), np.uint8)

    cv2.circle(circle_img, (x,y), int(r), 1, thickness=-1)

    img = cv2.bitwise_and(img, img, mask=circle_img)

    img = crop_image_from_gray(img)

    img=cv2.addWeighted ( img,4, cv2.GaussianBlur( img , (0,0) , sigmaX) ,-4 ,128)

    return img
%%time

## try circle crop

NUM_SAMP=7

fig = plt.figure(figsize=(25, 16))

for class_id in sorted(train_y.unique()):

    for i, (idx, row) in enumerate(df_train.loc[df_train['diagnosis'] == class_id].sample(NUM_SAMP, random_state=SEED).iterrows()):

        ax = fig.add_subplot(5, NUM_SAMP, class_id * NUM_SAMP + i + 1, xticks=[], yticks=[])

        path="F:\\kaggleDataSet\\diabeticRetinopathy\\resized train 19\\"+str(row['id_code'])+".jpg"

        image = circle_crop(path,sigmaX=30)

        plt.imshow(image)

        ax.set_title('%d-%d-%s' % (class_id, idx, row['id_code']) )
dpi = 80 #inch

path="F:\\kaggleDataSet\\diabeticRetinopathy\\resized train 19\\cd54d022e37d.jpg"

image = load_ben_color(path,sigmaX=10)

height, width = IMG_SIZE, IMG_SIZE

print(height, width)

SCALE=1

figsize = (width / float(dpi))/SCALE, (height / float(dpi))/SCALE

fig = plt.figure(figsize=figsize)

plt.imshow(image, cmap='gray')
%%time

NUM_SAMP=10

fig = plt.figure(figsize=(25, 16))

for jj in range(5):

    for i, (idx, row) in enumerate(df_test.sample(NUM_SAMP,random_state=SEED+jj).iterrows()):

        ax = fig.add_subplot(5, NUM_SAMP, jj * NUM_SAMP + i + 1, xticks=[], yticks=[])

        path="F:\\kaggleDataSet\\diabeticRetinopathy\\resized test 19\\"+str(row['id_code'])+".jpg"

        image = load_ben_color(path,sigmaX=30)

        plt.imshow(image)

        ax.set_title('%d-%s' % (idx, row['id_code']) )

%%time

NUM_SAMP=10

fig = plt.figure(figsize=(25, 16))

for jj in range(5):

    for i, (idx, row) in enumerate(df_test.sample(NUM_SAMP,random_state=SEED+jj).iterrows()):

        ax = fig.add_subplot(5, NUM_SAMP, jj * NUM_SAMP + i + 1, xticks=[], yticks=[])

        path="F:\\kaggleDataSet\\diabeticRetinopathy\\resized test 19\\"+str(row['id_code'])+".jpg"

        image = load_ben_color(path,sigmaX=50)

        plt.imshow(image, cmap='gray')

        ax.set_title('%d-%s' % (idx, row['id_code']) )
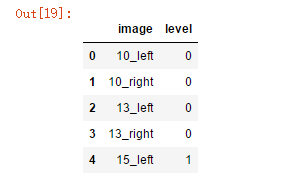
df_old = pd.read_csv('F:\\kaggleDataSet\\diabeticRetinopathy\\trainLabels.csv')

df_old.head()
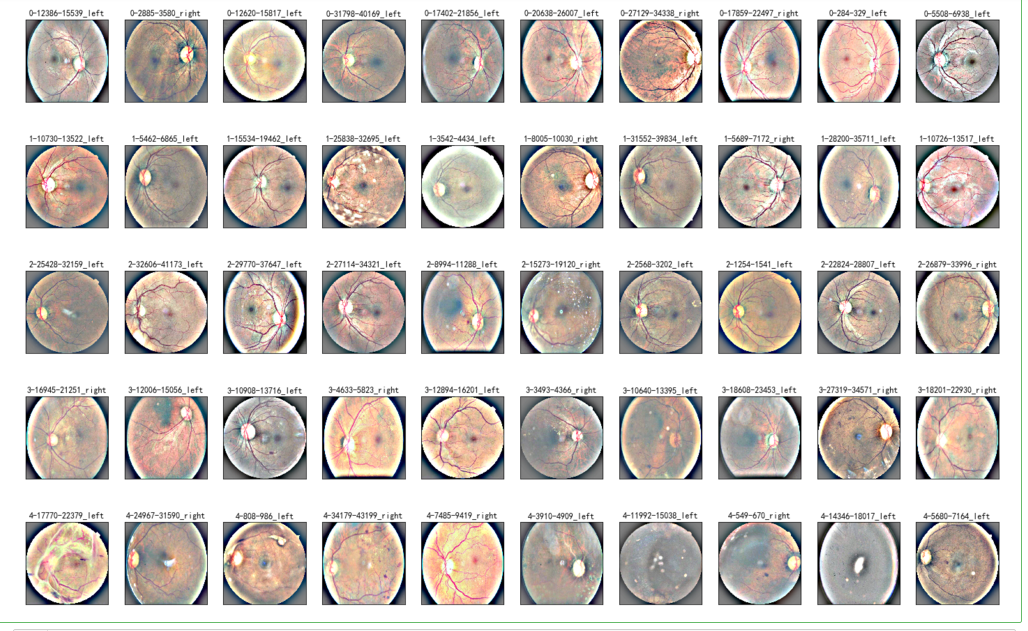
NUM_SAMP=10

fig = plt.figure(figsize=(25, 16))

for class_id in sorted(train_y.unique()):

    for i, (idx, row) in enumerate(df_old.loc[df_old['level'] == class_id].sample(NUM_SAMP, random_state=SEED).iterrows()):

        ax = fig.add_subplot(5, NUM_SAMP, class_id * NUM_SAMP + i + 1, xticks=[], yticks=[])

        path="F:\\kaggleDataSet\\diabeticRetinopathy\\resized_train\\"+row['image']+".jpeg"

        image = load_ben_color(path,sigmaX=30)

        plt.imshow(image)

        ax.set_title('%d-%d-%s' % (class_id, idx, row['image']) )
NUM_SAMP=10

fig = plt.figure(figsize=(25, 16))

for class_id in sorted(train_y.unique()):

    for i, (idx, row) in enumerate(df_old.loc[df_old['level'] == class_id].sample(NUM_SAMP, random_state=SEED).iterrows()):

        ax = fig.add_subplot(5, NUM_SAMP, class_id * NUM_SAMP + i + 1, xticks=[], yticks=[])

        path="F:\\kaggleDataSet\\diabeticRetinopathy\\resized_train\\"+row['image']+".jpeg"

        image = cv2.imread(path)

        image = cv2.cvtColor(image, cv2.COLOR_BGR2RGB)

        image = cv2.resize(image, (IMG_SIZE, IMG_SIZE))

        plt.imshow(image, cmap='gray')

        ax.set_title('%d-%d-%s' % (class_id, idx, row['image']) )

dpi = 80 #inch

path=f"F:\\kaggleDataSet\\diabeticRetinopathy\\resized_train\\31590_right.jpeg" # too many vessels?

image = load_ben_color(path,sigmaX=30)

# image = cv2.imread(path)

# image = cv2.cvtColor(image, cv2.COLOR_BGR2GRAY)

# image = crop_image1(image)

# image = cv2.resize(image, (IMG_SIZE, IMG_SIZE))

# image=cv2.addWeighted ( image,4, cv2.GaussianBlur( image , (0,0) , IMG_SIZE/10) ,-4 ,128)

height, width = IMG_SIZE, IMG_SIZE

print(height, width)

SCALE=1

figsize = (width / float(dpi))/SCALE, (height / float(dpi))/SCALE

fig = plt.figure(figsize=figsize)

plt.imshow(image, cmap='gray')
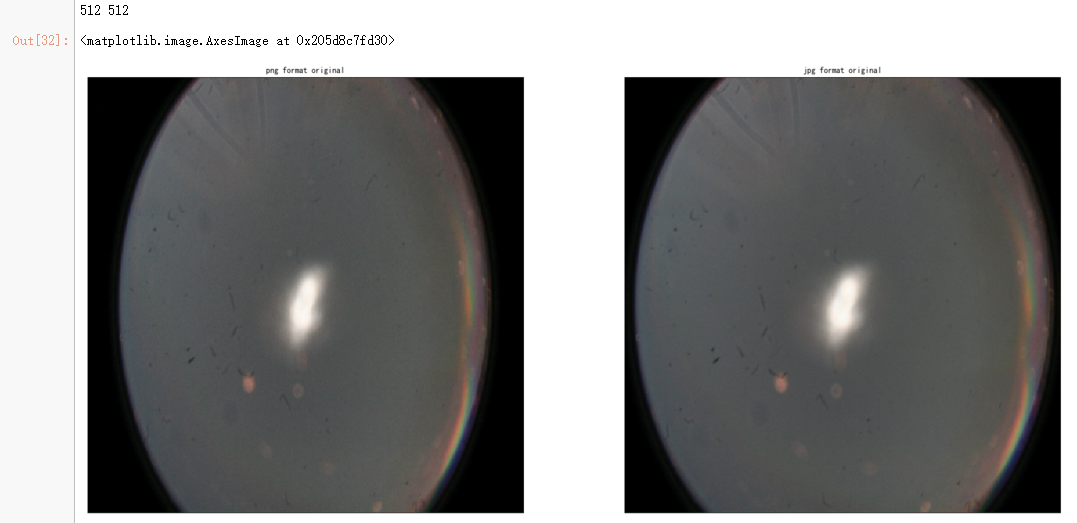
dpi = 80 #inch

path_jpg=f"F:\\kaggleDataSet\\diabeticRetinopathy\\resized_train_cropped\\18017_left.jpeg" # too many vessels?

path_png=f"F:\\kaggleDataSet\\diabeticRetinopathy\\rescaled_train_896\\18017_left.png" # details are lost

image = cv2.imread(path_png)

image = cv2.cvtColor(image, cv2.COLOR_BGR2RGB)

image = cv2.resize(image, (IMG_SIZE, IMG_SIZE))

image2 =  cv2.imread(path_jpg)

image2 = cv2.cvtColor(image2, cv2.COLOR_BGR2RGB)

image2 = cv2.resize(image2, (IMG_SIZE, IMG_SIZE))

height, width = IMG_SIZE, IMG_SIZE

print(height, width)

SCALE=1/4

figsize = (width / float(dpi))/SCALE, (height / float(dpi))/SCALE

fig = plt.figure(figsize=figsize)

ax = fig.add_subplot(2, 2, 1, xticks=[], yticks=[])

ax.set_title('png format original' )

plt.imshow(image, cmap='gray')

ax = fig.add_subplot(2, 2, 2, xticks=[], yticks=[])

ax.set_title('jpg format original' )

plt.imshow(image2, cmap='gray')

image = load_ben_color(path_png,sigmaX=30)

image2 = load_ben_color(path_jpg,sigmaX=30)

ax = fig.add_subplot(2, 2, 3, xticks=[], yticks=[])

ax.set_title('png format transformed' )

plt.imshow(image, cmap='gray')

ax = fig.add_subplot(2, 2, 4, xticks=[], yticks=[])

ax.set_title('jpg format transformed' )

plt.imshow(image2, cmap='gray')

import json

import math

import os

import cv2

from PIL import Image

import numpy as np

from keras import layers

from keras.applications import DenseNet121

from keras.callbacks import Callback, ModelCheckpoint

from keras.preprocessing.image import ImageDataGenerator

from keras.models import Sequential

from keras.optimizers import Adam

import matplotlib.pyplot as plt

import pandas as pd

from sklearn.model_selection import train_test_split

from sklearn.metrics import cohen_kappa_score, accuracy_score

import scipy

from tqdm import tqdm

%matplotlib inline
train_df = pd.read_csv('F:\\kaggleDataSet\\diabeticRetinopathy\\trainLabels19.csv')

test_df = pd.read_csv('F:\\kaggleDataSet\\diabeticRetinopathy\\testImages19.csv')

print(train_df.shape)

print(test_df.shape)

test_df.head()
def get_pad_width(im, new_shape, is_rgb=True):

    pad_diff = new_shape - im.shape[0], new_shape - im.shape[1]

    t, b = math.floor(pad_diff[0]/2), math.ceil(pad_diff[0]/2)

    l, r = math.floor(pad_diff[1]/2), math.ceil(pad_diff[1]/2)

    if is_rgb:

        pad_width = ((t,b), (l,r), (0, 0))

    else:

        pad_width = ((t,b), (l,r))

    return pad_width

def preprocess_image(image_path, desired_size=224):

    im = Image.open(image_path)

    im = im.resize((desired_size, )*2, resample=Image.LANCZOS)

    return im
N = test_df.shape[0]

x_test = np.empty((N, 224, 224, 3), dtype=np.uint8)

for i, image_id in enumerate(tqdm(test_df['id_code'])):

    x_test[i, :, :, :] = preprocess_image("F:\\kaggleDataSet\\diabeticRetinopathy\\resized test 19\\"+str(image_id)+".jpg")

# model.summary()

def load_image_ben_orig(path,resize=True,crop=False,norm255=True,keras=False):

    image = cv2.imread(path)

    image = cv2.cvtColor(image, cv2.COLOR_BGR2RGB)

    image=cv2.addWeighted( image,4, cv2.GaussianBlur( image , (0,0) ,  10) ,-4 ,128)

    if norm255:

        return image/255

    elif keras:

        #see https://github.com/keras-team/keras-applications/blob/master/keras_applications/imagenet_utils.py for mode

        #see https://github.com/keras-team/keras-applications/blob/master/keras_applications/xception.py for inception,xception mode

        #the use of tf based preprocessing (- and / by 127 respectively) will results in [-1,1] so it will not visualize correctly (directly)

        image = np.expand_dims(image, axis=0)

        return preprocess_input(image)[0]

    else:

        return image.astype(np.int16)

    return image

def transform_image_ben(img,resize=True,crop=False,norm255=True,keras=False):

    image=cv2.addWeighted( img,4, cv2.GaussianBlur( img , (0,0) ,  10) ,-4 ,128)

    if norm255:

        return image/255

    elif keras:

        image = np.expand_dims(image, axis=0)

        return preprocess_input(image)[0]

    else:

        return image.astype(np.int16)

    return image
def display_samples(df, columns=5, rows=2, Ben=True):

    fig=plt.figure(figsize=(5*columns, 4*rows))

    for i in range(columns*rows):

        image_path = df.loc[i,'id_code']

        path = f"F:\\kaggleDataSet\\diabeticRetinopathy\\resized test 19\\"+str(image_path)+".jpg"

        if Ben:

            img = load_image_ben_orig(path)

        else:

            img = cv2.imread(path)

            img = cv2.cvtColor(img, cv2.COLOR_BGR2RGB)

        fig.add_subplot(rows, columns, i+1)

        plt.imshow(img)

    plt.tight_layout()

display_samples(test_df, Ben=False)

display_samples(test_df, Ben=True)
from keras import layers

from keras.models import Model

import keras.backend as K
K.clear_session()

densenet = DenseNet121(weights=None,include_top=False,input_shape=(None,None,3))
GAP_layer = layers.GlobalAveragePooling2D()

drop_layer = layers.Dropout(0.5)

dense_layer = layers.Dense(5, activation='sigmoid', name='final_output')
def build_model_sequential():

    model = Sequential()

    model.add(densenet)

    model.add(GAP_layer)

    model.add(drop_layer)

    model.add(dense_layer)

    return model
modelA = build_model_sequential()

modelA.load_weights('F:\\kaggleDataSet\\diabeticRetinopathy\\dense_xhlulu_731.h5')

modelA.summary()
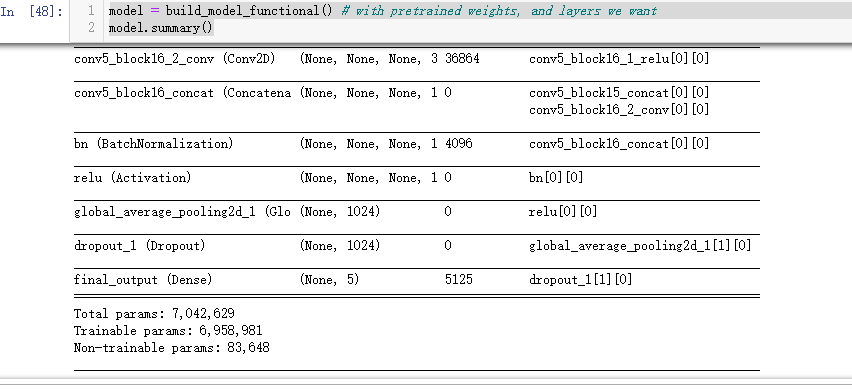
model = build_model_functional() # with pretrained weights, and layers we want

model.summary()
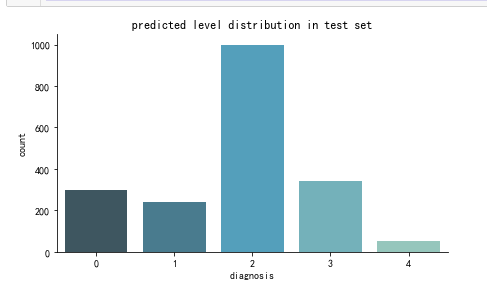
y_test = model.predict(x_test) > 0.5

y_test = y_test.astype(int).sum(axis=1) - 1
import seaborn as sns

import cv2

SIZE=224

def create_pred_hist(pred_level_y,title='NoTitle'):

    results = pd.DataFrame({'diagnosis':pred_level_y})

    f, ax = plt.subplots(figsize=(7, 4))

    ax = sns.countplot(x="diagnosis", data=results, palette="GnBu_d")

    sns.despine()

    plt.title(title)

    plt.show()

create_pred_hist(y_test,title='predicted level distribution in test set')
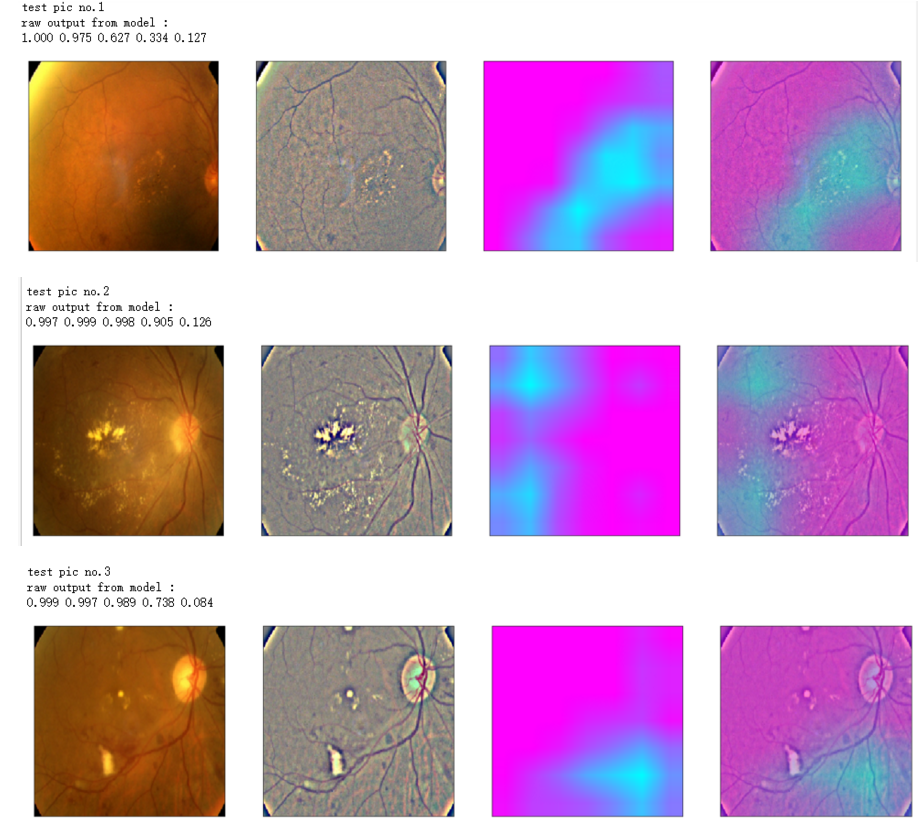
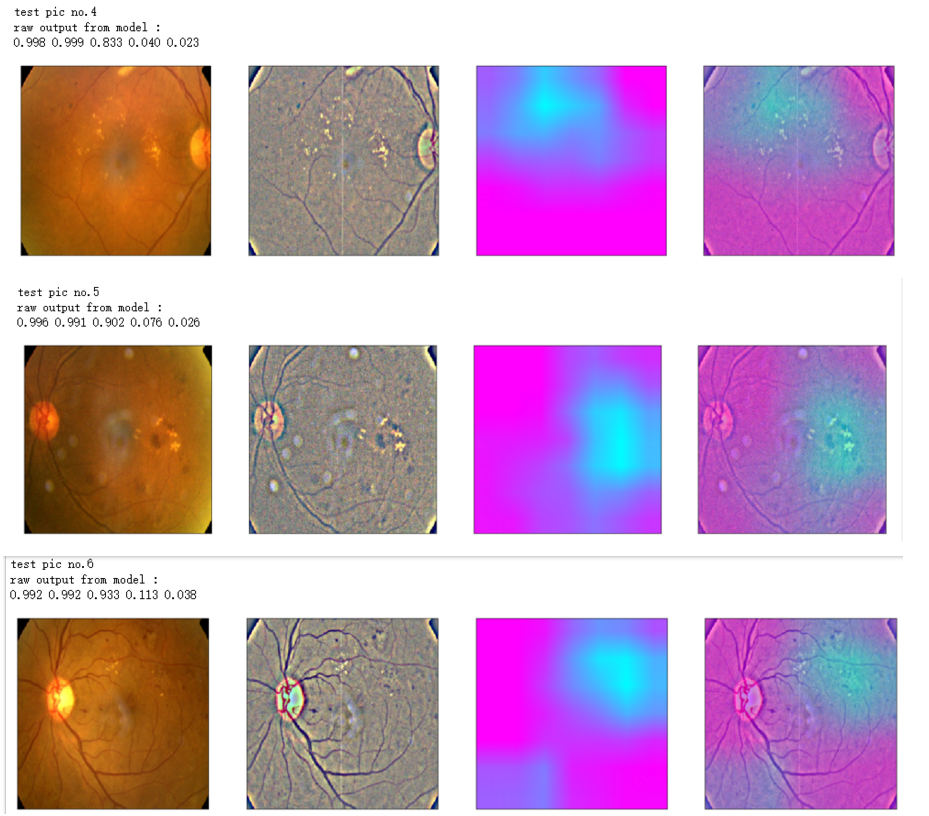
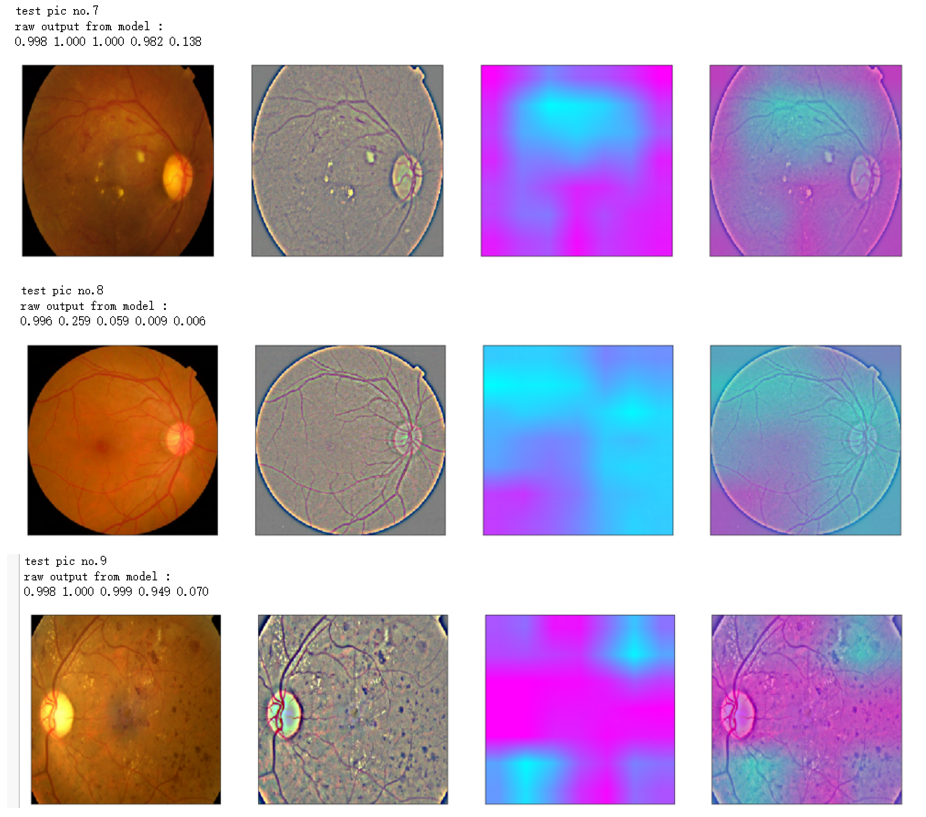
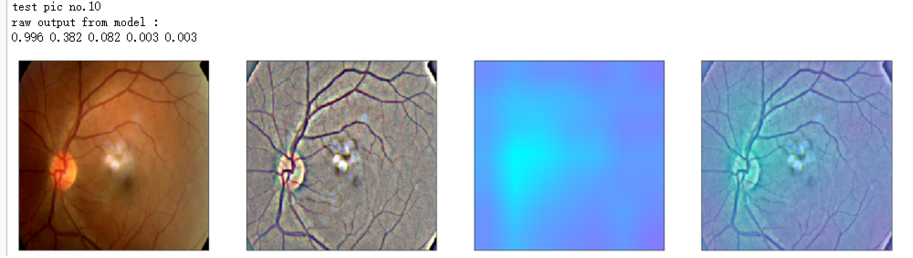
def gen_heatmap_img(img, model0, layer_name='last_conv_layer',viz_img=None,orig_img=None):

    preds_raw = model0.predict(img[np.newaxis])

    preds = preds_raw > 0.5 # use the same threshold as @xhlulu original kernel

    class_idx = (preds.astype(int).sum(axis=1) - 1)[0]

    class_output_tensor = model0.output[:, class_idx]

    viz_layer = model0.get_layer(layer_name)

    grads = K.gradients(class_output_tensor ,viz_layer.output)[0] # gradients of viz_layer wrt output_tensor of predicted class

    pooled_grads=K.mean(grads,axis=(0,1,2))

    iterate=K.function([model0.input],[pooled_grads, viz_layer.output[0]])

    pooled_grad_value, viz_layer_out_value = iterate([img[np.newaxis]])

    for i in range(pooled_grad_value.shape[0]):

        viz_layer_out_value[:,:,i] *= pooled_grad_value[i]

    heatmap = np.mean(viz_layer_out_value, axis=-1)

    heatmap = np.maximum(heatmap,0)

    heatmap /= np.max(heatmap)

    viz_img=cv2.resize(viz_img,(img.shape[1],img.shape[0]))

    heatmap=cv2.resize(heatmap,(viz_img.shape[1],viz_img.shape[0]))

    heatmap_color = cv2.applyColorMap(np.uint8(heatmap*255), cv2.COLORMAP_SPRING)/255

    heated_img = heatmap_color*0.5 + viz_img*0.5

    print('raw output from model : ')

    print_pred(preds_raw)

    if orig_img is None:

        show_Nimages([img,viz_img,heatmap_color,heated_img])

    else:

        show_Nimages([orig_img,img,viz_img,heatmap_color,heated_img])

    plt.show()

    return heated_img
def show_image(image,figsize=None,title=None):

    if figsize is not None:

        fig = plt.figure(figsize=figsize)

    if image.ndim == 2:

        plt.imshow(image,cmap='gray')

    else:

        plt.imshow(image)

    if title is not None:

        plt.title(title)

def show_Nimages(imgs,scale=1):

    N=len(imgs)

    fig = plt.figure(figsize=(25/scale, 16/scale))

    for i, img in enumerate(imgs):

        ax = fig.add_subplot(1, N, i + 1, xticks=[], yticks=[])

        show_image(img)

def print_pred(array_of_classes):

    xx = array_of_classes

    s1,s2 = xx.shape

    for i in range(s1):

        for j in range(s2):

            print('%.3f ' % xx[i,j],end='')

        print('')
NUM_SAMP=10

SEED=77

layer_name = 'relu' #'conv5_block16_concat'

for i, (idx, row) in enumerate(test_df[:NUM_SAMP].iterrows()):

    path=f"F:\\kaggleDataSet\\diabeticRetinopathy\\resized test 19\\"+str(row["id_code"])+".jpg"

    ben_img = load_image_ben_orig(path)

    input_img = np.empty((1,224, 224, 3), dtype=np.uint8)

    input_img[0,:,:,:] = preprocess_image(path)

    print('test pic no.%d' % (i+1))

    _ = gen_heatmap_img(input_img[0],model, layer_name=layer_name,viz_img=ben_img)
from albumentations import *
import time IMG_SIZE = (224,224) '''Use case from https://www.kaggle.com/alexanderliao/image-augmentation-demo-with-albumentation/'''
def albaugment(aug0, img):
return aug0(image=img)['image']
idx=8
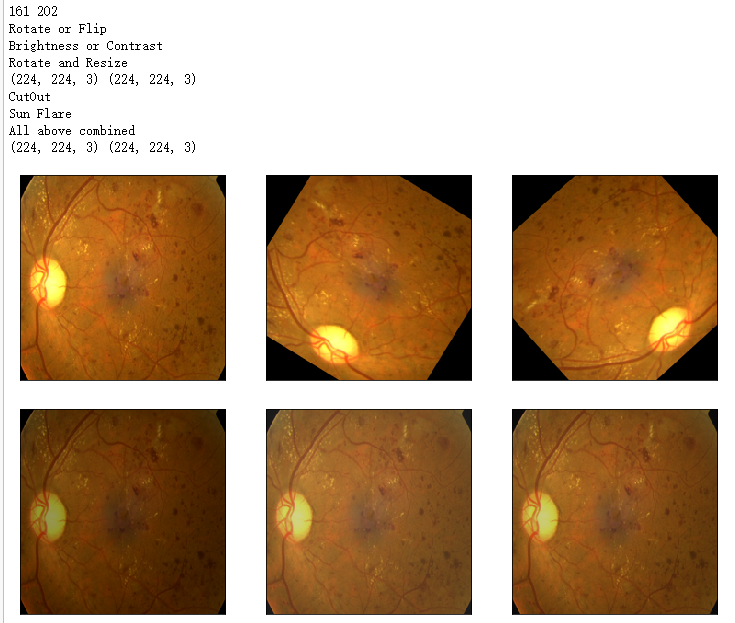
image1=x_test[idx] '''1. Rotate or Flip'''
aug1 = OneOf([Rotate(p=0.99, limit=160, border_mode=0,value=0), Flip(p=0.5)],p=1) '''2. Adjust Brightness or Contrast'''
aug2 = RandomBrightnessContrast(brightness_limit=0.45, contrast_limit=0.45,p=1)
h_min=np.round(IMG_SIZE[1]*0.72).astype(int)
h_max= np.round(IMG_SIZE[1]*0.9).astype(int)
print(h_min,h_max) '''3. Random Crop and then Resize'''
#w2h_ratio = aspect ratio of cropping
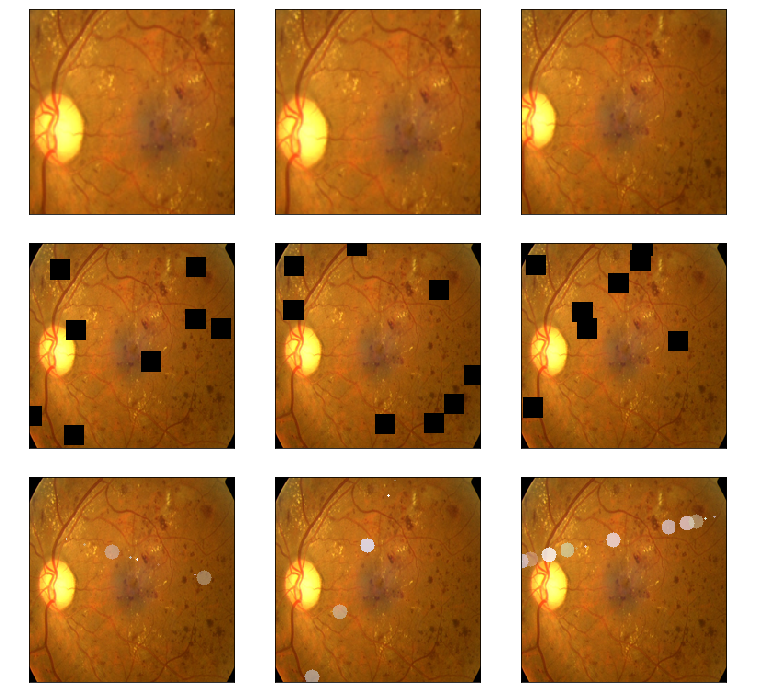
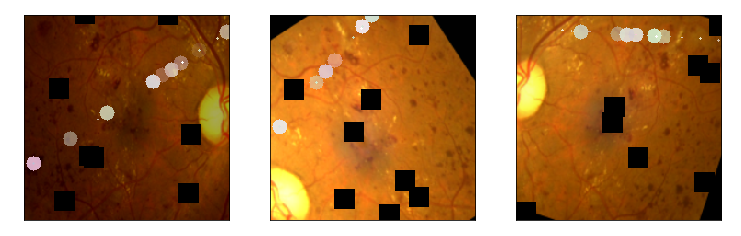
aug3 = RandomSizedCrop((h_min, h_max),IMG_SIZE[1],IMG_SIZE[0], w2h_ratio=IMG_SIZE[0]/IMG_SIZE[1],p=1) '''4. CutOut Augmentation'''
max_hole_size = int(IMG_SIZE[1]/10)
aug4 = Cutout(p=1,max_h_size=max_hole_size,max_w_size=max_hole_size,num_holes=8 )#default num_holes=8 '''5. SunFlare Augmentation'''
aug5 = RandomSunFlare(src_radius=max_hole_size,num_flare_circles_lower=10,num_flare_circles_upper=20,p=1) '''6. Ultimate Augmentation -- combine everything'''
final_aug = Compose([aug1,aug2,aug3,aug4,aug5],p=1) img1 = albaugment(aug1,image1)
img2 = albaugment(aug1,image1)
print('Rotate or Flip')
show_Nimages([image1,img1,img2],scale=2)
# time.sleep(1) img1 = albaugment(aug2,image1)
img2 = albaugment(aug2,image1)
img3 = albaugment(aug2,image1)
print('Brightness or Contrast')
show_Nimages([img3,img1,img2],scale=2)
# time.sleep(1) img1 = albaugment(aug3,image1)
img2 = albaugment(aug3,image1)
img3 = albaugment(aug3,image1)
print('Rotate and Resize')
show_Nimages([img3,img1,img2],scale=2)
print(img1.shape,img2.shape)
# time.sleep(1) img1 = albaugment(aug4,image1)
img2 = albaugment(aug4,image1)
img3 = albaugment(aug4,image1)
print('CutOut')
show_Nimages([img3,img1,img2],scale=2)
# time.sleep(1) img1 = albaugment(aug5,image1)
img2 = albaugment(aug5,image1)
img3 = albaugment(aug5,image1)
print('Sun Flare')
show_Nimages([img3,img1,img2],scale=2)
# time.sleep(1) img1 = albaugment(final_aug,image1)
img2 = albaugment(final_aug,image1)
img3 = albaugment(final_aug,image1)
print('All above combined')
show_Nimages([img3,img1,img2],scale=2)
print(img1.shape,img2.shape)
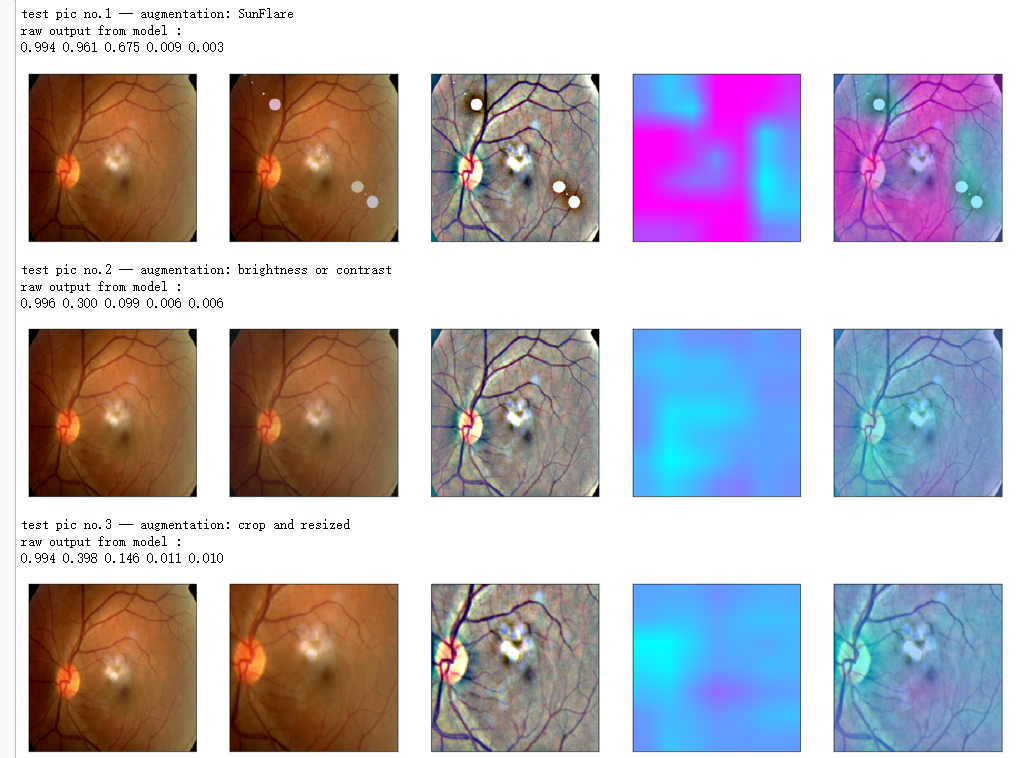
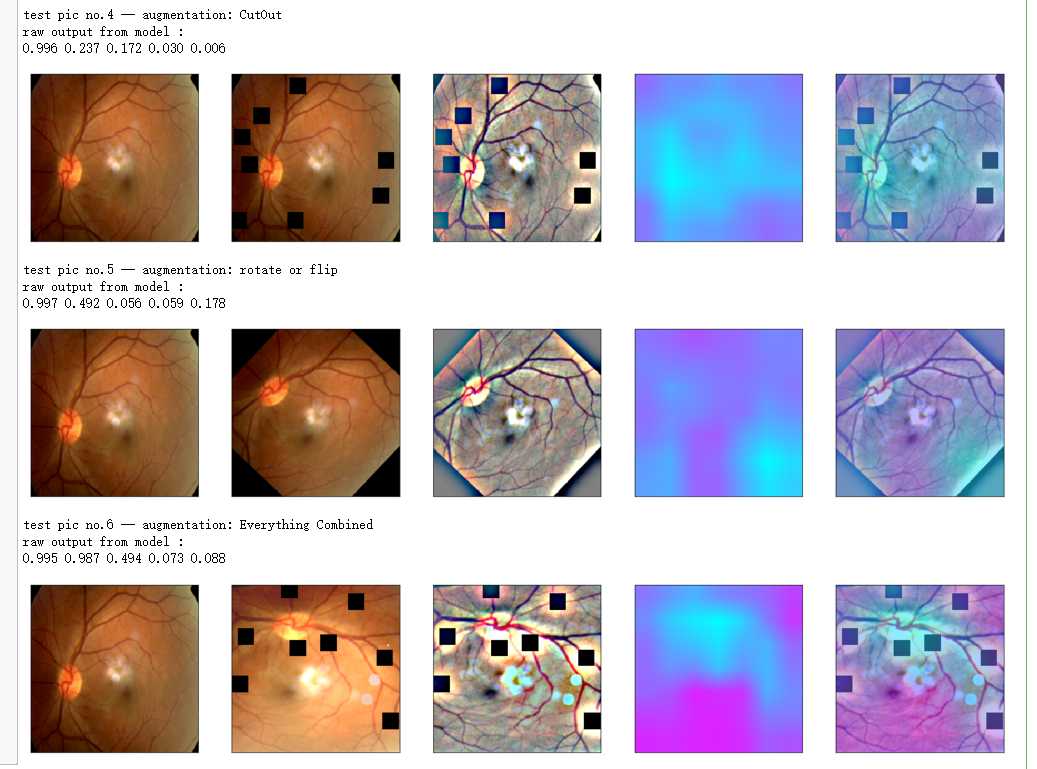
aug_list = [aug5, aug2, aug3, aug4, aug1, final_aug]

aug_name = ['SunFlare', 'brightness or contrast', 'crop and resized', 'CutOut', 'rotate or flip', 'Everything Combined']

idx=8

layer_name = 'relu'

for i in range(len(aug_list)):

    path=f"F:\\kaggleDataSet\\diabeticRetinopathy\\resized test 19\\"+str(row["id_code"])+".jpg"

    input_img = np.empty((1,224, 224, 3), dtype=np.uint8)

    input_img[0,:,:,:] = preprocess_image(path)

    aug_img = albaugment(aug_list[i],input_img[0,:,:,:])

    ben_img = transform_image_ben(aug_img)

    print('test pic no.%d -- augmentation: %s' % (i+1, aug_name[i]))

    _ = gen_heatmap_img(aug_img,model, layer_name=layer_name,viz_img=ben_img,orig_img=input_img[0])
吴裕雄--天生自然 PYTHON数据分析:糖尿病视网膜病变数据分析(完整版)的更多相关文章
- 吴裕雄--天生自然 PYTHON数据分析:所有美国股票和etf的历史日价格和成交量分析
# This Python 3 environment comes with many helpful analytics libraries installed # It is defined by ...
- 吴裕雄--天生自然 python数据分析:健康指标聚集分析(健康分析)
# This Python 3 environment comes with many helpful analytics libraries installed # It is defined by ...
- 吴裕雄--天生自然 python数据分析:葡萄酒分析
# import pandas import pandas as pd # creating a DataFrame pd.DataFrame({'Yes': [50, 31], 'No': [101 ...
- 吴裕雄--天生自然 PYTHON数据分析:人类发展报告——HDI, GDI,健康,全球人口数据数据分析
import pandas as pd # Data analysis import numpy as np #Data analysis import seaborn as sns # Data v ...
- 吴裕雄--天生自然 python数据分析:医疗费数据分析
import numpy as np import pandas as pd import os import matplotlib.pyplot as pl import seaborn as sn ...
- 吴裕雄--天生自然 PYTHON语言数据分析:ESA的火星快车操作数据集分析
import os import numpy as np import pandas as pd from datetime import datetime import matplotlib imp ...
- 吴裕雄--天生自然 python语言数据分析:开普勒系外行星搜索结果分析
import pandas as pd pd.DataFrame({'Yes': [50, 21], 'No': [131, 2]}) pd.DataFrame({'Bob': ['I liked i ...
- 吴裕雄--天生自然 PYTHON数据分析:基于Keras的CNN分析太空深处寻找系外行星数据
#We import libraries for linear algebra, graphs, and evaluation of results import numpy as np import ...
- 吴裕雄--天生自然 python数据分析:基于Keras使用CNN神经网络处理手写数据集
import pandas as pd import numpy as np import matplotlib.pyplot as plt import matplotlib.image as mp ...
随机推荐
- 使用Java注解实现简单的依赖注入
代码如下: /** * 注入的注解,为空,仅起标志作用 */ @Target({ElementType.FIELD}) @Retention(RetentionPolicy.RUNTIME) @int ...
- Gorm与数据库(单复数)表结构之间的映射
Gorm连接MySQL: import ( _ "github.com/go-sql-driver/mysql" "github.com/jinzhu/gorm" ...
- Go语言实现:【剑指offer】复杂链表的复制
该题目来源于牛客网<剑指offer>专题. 输入一个复杂链表(每个节点中有节点值,以及两个指针,一个指向下一个节点,另一个特殊指针指向任意一个节点),返回结果为复制后复杂链表的head.( ...
- 移植freertos到stm32 f103 的基本流程和总结
为什么要在stm32 f103上面移植freertos stm32 f103 以他的全面的文档,亲民的价格,强大的功能.成为无数微设备的方案首选.在市场上有极大的使用量.市场占有率也是非常的高.f ...
- ssh连接超时的问题
vi /etc/ssh/sshd_config ClientAliveInterval ClientAliveCountMax # 注: # ClientAliveInterval选项定义了每隔多少秒 ...
- VFP日期时间转中文日期时间
本函数原为VFP中取日期转中文日期方式,后增加日期时间处理,并改用Iif及ICase修改原代码.Function DateTime2CHNParameters pdDate,plTime*!* pdD ...
- Effective Java, Third Edition
https://github.com/jbloch/effective-java-3e-source-code 网址是 Effetive java的源码 effective-java-3e-sourc ...
- crul 命令访问公网 dns解析错误 程序报错
今天机房几台服务器都无法访问公网接口,原因是——解析公网域名出错,具体情况如下 ping 公网ip或者域名 都没有问题 curl 公网域名 出错 curl -4 访问公网域名没有问题 综合分析 ...
- 软件bug描述(web)
1.bug编码与名称:测试日期+bug字段 2.测试环境:浏览器:全部/IE8,操作系统:win7 x64 3. 测试数据:用户名,密码,相关的业务账号 4.重现步骤:缺陷发现的过程 5. 缺陷说明: ...
- Day6前端学习之路——布局
一.定位 1)静态定位 position:static(默认) 2)相对定位 position:relative(要配合top.bottom.left.right等属性来使用) 3)绝对定位 pos ...