
吴裕雄--天生自然 PYTHON数据分析:所有美国股票和etf的历史日价格和成交量分析
# This Python 3 environment comes with many helpful analytics libraries installed

# It is defined by the kaggle/python docker image: https://github.com/kaggle/docker-python

# For example, here's several helpful packages to load in

import matplotlib.pyplot as plt

import statsmodels.tsa.seasonal as smt

import numpy as np # linear algebra

import pandas as pd # data processing, CSV file I/O (e.g. pd.read_csv)

import random

import datetime as dt

from sklearn import linear_model

from sklearn.metrics import mean_absolute_error

import plotly

# import the relevant Keras modules

from keras.models import Sequential

from keras.layers import Activation, Dense

from keras.layers import LSTM

from keras.layers import Dropout

# Input data files are available in the "../input/" directory.

# For example, running this (by clicking run or pressing Shift+Enter) will list the files in the input directory

from subprocess import check_output
import os

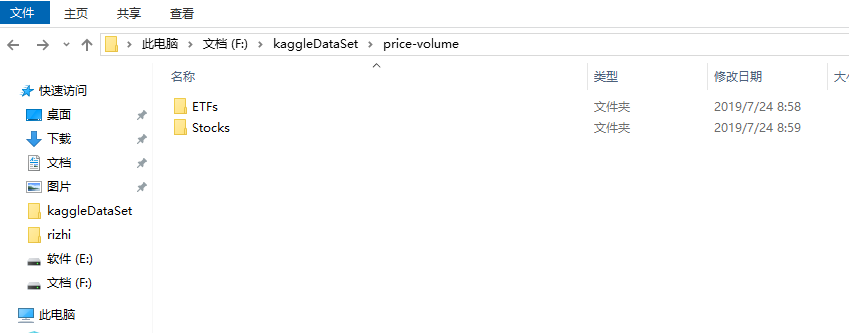
os.chdir('F:\\kaggleDataSet\\price-volume\\Stocks')
#read data

# kernels let us navigate through the zipfile as if it were a directory

# trying to read a file of size zero will throw an error, so skip them

# filenames = [x for x in os.listdir() if x.endswith('.txt') and os.path.getsize(x) > 0]

# filenames = random.sample(filenames,1)

filenames = ['prk.us.txt', 'bgr.us.txt', 'jci.us.txt', 'aa.us.txt', 'fr.us.txt', 'star.us.txt', 'sons.us.txt', 'ipl_d.us.txt', 'sna.us.txt', 'utg.us.txt']

filenames = [filenames[1]]

print(filenames)

data = []

for filename in filenames:

    df = pd.read_csv(filename, sep=',')

    label, _, _ = filename.split(sep='.')

    df['Label'] = filename

    df['Date'] = pd.to_datetime(df['Date'])

    data.append(df)

traces = []

for df in data:

    clr = str(r()) + str(r()) + str(r())

    df = df.sort_values('Date')

    label = df['Label'].iloc[0]

    trace = plotly.graph_objs.Scattergl(x=df['Date'],y=df['Close'])

    traces.append(trace)

layout = plotly.graph_objs.Layout(title='Plot',)

fig = plotly.graph_objs.Figure(data=traces, layout=layout)

plotly.offline.init_notebook_mode(connected=True)

plotly.offline.iplot(fig, filename='dataplot')

df = data[0]

window_len = 10

#Create a data point (i.e. a date) which splits the training and testing set

split_date = list(data[0]["Date"][-(2*window_len+1):])[0]

#Split the training and test set

training_set, test_set = df[df['Date'] < split_date], df[df['Date'] >= split_date]

training_set = training_set.drop(['Date','Label', 'OpenInt'], 1)

test_set = test_set.drop(['Date','Label','OpenInt'], 1)

#Create windows for training

LSTM_training_inputs = []

for i in range(len(training_set)-window_len):

    temp_set = training_set[i:(i+window_len)].copy()

    for col in list(temp_set):

        temp_set[col] = temp_set[col]/temp_set[col].iloc[0] - 1

    LSTM_training_inputs.append(temp_set)

LSTM_training_outputs = (training_set['Close'][window_len:].values/training_set['Close'][:-window_len].values)-1

LSTM_training_inputs = [np.array(LSTM_training_input) for LSTM_training_input in LSTM_training_inputs]

LSTM_training_inputs = np.array(LSTM_training_inputs)

#Create windows for testing

LSTM_test_inputs = []

for i in range(len(test_set)-window_len):

    temp_set = test_set[i:(i+window_len)].copy()

    for col in list(temp_set):

        temp_set[col] = temp_set[col]/temp_set[col].iloc[0] - 1

    LSTM_test_inputs.append(temp_set)

LSTM_test_outputs = (test_set['Close'][window_len:].values/test_set['Close'][:-window_len].values)-1

LSTM_test_inputs = [np.array(LSTM_test_inputs) for LSTM_test_inputs in LSTM_test_inputs]

LSTM_test_inputs = np.array(LSTM_test_inputs)
def build_model(inputs, output_size, neurons, activ_func="linear",dropout=0.10, loss="mae", optimizer="adam"):

    model = Sequential()

    model.add(LSTM(neurons, input_shape=(inputs.shape[1], inputs.shape[2])))

    model.add(Dropout(dropout))

    model.add(Dense(units=output_size))

    model.add(Activation(activ_func))

    model.compile(loss=loss, optimizer=optimizer)

    return model
# initialise model architecture

nn_model = build_model(LSTM_training_inputs, output_size=1, neurons = 32)

# model output is next price normalised to 10th previous closing price

# train model on data

# note: eth_history contains information on the training error per epoch

nn_history = nn_model.fit(LSTM_training_inputs, LSTM_training_outputs, epochs=5, batch_size=1, verbose=2, shuffle=True)

plt.plot(LSTM_test_outputs, label = "actual")

plt.plot(nn_model.predict(LSTM_test_inputs), label = "predicted")

plt.legend()

plt.show()

MAE = mean_absolute_error(LSTM_test_outputs, nn_model.predict(LSTM_test_inputs))

print('The Mean Absolute Error is: {}'.format(MAE))

#https://github.com/llSourcell/How-to-Predict-Stock-Prices-Easily-Demo/blob/master/lstm.py

def predict_sequence_full(model, data, window_size):

    #Shift the window by 1 new prediction each time, re-run predictions on new window

    curr_frame = data[0]

    predicted = []

    for i in range(len(data)):

        predicted.append(model.predict(curr_frame[np.newaxis,:,:])[0,0])

        curr_frame = curr_frame[1:]

        curr_frame = np.insert(curr_frame, [window_size-1], predicted[-1], axis=0)

    return predicted

predictions = predict_sequence_full(nn_model, LSTM_test_inputs, 10)

plt.plot(LSTM_test_outputs, label="actual")

plt.plot(predictions, label="predicted")

plt.legend()

plt.show()

MAE = mean_absolute_error(LSTM_test_outputs, predictions)

print('The Mean Absolute Error is: {}'.format(MAE))
结论

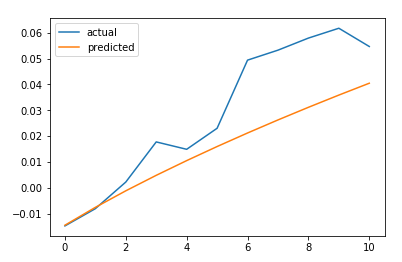
LSTM不能解决时间序列预测问题。对一个时间步长的预测并不比滞后模型好多少。如果我们增加预测的时间步长,性能下降的速度就不会像其他更传统的方法那么快。然而,在这种情况下,我们的误差增加了大约4.5倍。它随着我们试图预测的时间步长呈超线性增长。
吴裕雄--天生自然 PYTHON数据分析:所有美国股票和etf的历史日价格和成交量分析的更多相关文章
- 吴裕雄--天生自然 PYTHON数据分析:糖尿病视网膜病变数据分析(完整版)
# This Python 3 environment comes with many helpful analytics libraries installed # It is defined by ...
- 吴裕雄--天生自然 python数据分析:健康指标聚集分析(健康分析)
# This Python 3 environment comes with many helpful analytics libraries installed # It is defined by ...
- 吴裕雄--天生自然 python数据分析:葡萄酒分析
# import pandas import pandas as pd # creating a DataFrame pd.DataFrame({'Yes': [50, 31], 'No': [101 ...
- 吴裕雄--天生自然 PYTHON数据分析:人类发展报告——HDI, GDI,健康,全球人口数据数据分析
import pandas as pd # Data analysis import numpy as np #Data analysis import seaborn as sns # Data v ...
- 吴裕雄--天生自然 python数据分析:医疗费数据分析
import numpy as np import pandas as pd import os import matplotlib.pyplot as pl import seaborn as sn ...
- 吴裕雄--天生自然 PYTHON数据分析:基于Keras的CNN分析太空深处寻找系外行星数据
#We import libraries for linear algebra, graphs, and evaluation of results import numpy as np import ...
- 吴裕雄--天生自然 python数据分析:基于Keras使用CNN神经网络处理手写数据集
import pandas as pd import numpy as np import matplotlib.pyplot as plt import matplotlib.image as mp ...
- 吴裕雄--天生自然 PYTHON数据分析:钦奈水资源管理分析
df = pd.read_csv("F:\\kaggleDataSet\\chennai-water\\chennai_reservoir_levels.csv") df[&quo ...
- 吴裕雄--天生自然 PYTHON数据分析:医疗数据分析
import numpy as np # linear algebra import pandas as pd # data processing, CSV file I/O (e.g. pd.rea ...
随机推荐
- [C/C++]_[Unicode转Utf8,Ansi转Unicode,Ansi文件转Utf8文件]
http://blog.csdn.net/infoworld/article/details/15337665 场景: 1.也就只有windows需要那么麻烦,还搞一个ANSI编码.学学mac os ...
- 闲谈一下,ES3、ES4、ES5、ES6 分别是什么
上图按照时间顺序说明了JavaScript.JScript和ECMAScript的发展. 显示在网景工作的Brendan Eich临危受命,用十天时间设计出LiveScript的第一个版本.临时发布前 ...
- LeetCode22 生成所有括号对
本文始发于个人公众号:TechFlow,原创不易,求个关注 链接 Generate Parentheses 难度 Medium 描述 Given n pairs of parentheses, wri ...
- pyinstaller相关问题 & pygame文件打包成exe文件 & 武装飞船 & 飞机大战
自己照书写了一个飞机大战游戏的python程序,想把它打包成一个exe文件,在查阅相关教程并经过数次尝试后终于成功. 安装打包应用 pyinstaller 在cmd命令窗口下pip install p ...
- LeetCode 23 Hard,K个链表归并
本文始发于个人公众号:TechFlow,原创不易,求个关注 链接 Merge k Sorted Lists 难度 Hard 描述 Merge k sorted linked lists and ret ...
- java架构之路-(微服务专题)nacos集群精讲实战
上次回顾: 上次博客,我们主要说了微服务的发展历程和nacos集群单机的搭建,单机需要-m standalone启动,集群建议使用nginx做一下反向代理,自行保证mysql和ngxin的高可用. 本 ...
- postman之上传文件
前言 小伙伴们在日常工作中有没测试过上传文件的接口呢?那么怎么用postman测试上传文件的接口呢?下面我们一起来学习吧! 需求:(1)上传接口地址:http://localhost:8080/pin ...
- Coroutine 练习 1 - Coroutine Exercises 1
Coroutine 练习 1 - Coroutine Exercises 1 字典中为动词 “to yield” 给出了两个释义:产出和让步.对于 Python 生成器中的 yield 来 说,这两个 ...
- 仅仅知道如何终止XHR请求,或许对你来说是不够的!
TLDR: 当我们需要的时候,我们可以通过AbortController接口来终止一个或者多个请求. 前言 到目前为止,我们有两个常用的基本的手段去发送请求进而局部刷新页面内容,其一是XMR(XMLH ...
- [Python]执行Linux命令
使用subprocess模块 import subprocess # 防火墙服务存在关闭状态 child1 = subprocess.Popen(["systemctl status fir ...