
[js高手之路] html5 canvas系列教程 - 掌握画直线图形的常用API
我们接着上文[js高手之路] html5 canvas系列教程 - 认识canvas以及基本使用方法继续.
一、直线的绘制
cxt.moveTo( x1, y1 ): 将画笔移动到x1, y1这个点
cxt.lineTo( x2, y2 ):将画笔从起点开始画直线,一直画到终点坐标( x2, y2 )
cxt.stroke();用画笔连线,moveTo,lineTo并不会产生实际的线条
x1,y1,x2,y2是点的坐标,canvas的坐标原点在canvas的左上角.
画一根直线:
 <style>

     body {

         background:#000;

     }

     #canvas {

         background:white;

     }

 </style>

 <script>

     window.onload = function(){

         var oCanvas = document.querySelector( "#canvas" ),

             oGc = oCanvas.getContext( '2d' );

         oGc.moveTo( 50, 50 );

         oGc.lineTo( 250, 50 );

         oGc.stroke();

     }

 </script>

 </head>

 <body>

 <canvas id="canvas"></canvas>

 </body>
如果把stroke注释了,是不会出现线条的,stoke的作用就是用来将点连起来
通过2个实例来区分,moveTo与lineTo的区别
 <style>

     body {

         background:#000;

     }

     #canvas {

         background:white;

     }

 </style>

 <script>

     window.onload = function(){

         var oCanvas = document.querySelector( "#canvas" ),

             oGc = oCanvas.getContext( '2d' );

         oGc.moveTo( 50, 50 );

         oGc.lineTo( 250, 50 );

         oGc.moveTo( 50, 200 );

         oGc.lineTo( 250, 200 );

         oGc.stroke();

         oGc.moveTo( 300, 50 );

         oGc.lineTo( 500, 50 );

         oGc.lineTo( 300, 200 );

         oGc.lineTo( 500, 200 );

         oGc.stroke();

     }

 </script>

 </head>

 <body>

 <canvas id="canvas" width="600" height="400"></canvas>

 </body>
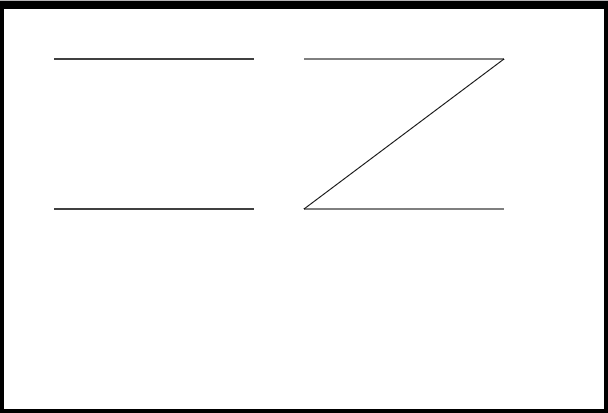
左右两边的线形图,代码就一点区别,左边图形是第二个点用了lineTo, 第三个点用了moveTo, 右边图形第二个点用了lineTo,第三个点还是lineTo,从图中你应该能感受到这两个方法的区别吧?
画三角形
 <style>

     body {

         background:#000;

     }

     #canvas {

         background:white;

     }

 </style>

 <script>

     window.onload = function(){

         var oCanvas = document.querySelector( "#canvas" ),

             oGc = oCanvas.getContext( '2d' );

         oGc.moveTo( 50, 50 );

         oGc.lineTo( 450, 50 );

         oGc.lineTo( 450, 300 );

         oGc.lineTo( 50, 50 );

         oGc.stroke();

     }

 </script>

 </head>

 <body>

 <canvas id="canvas" width="600" height="400"></canvas>

 </body>
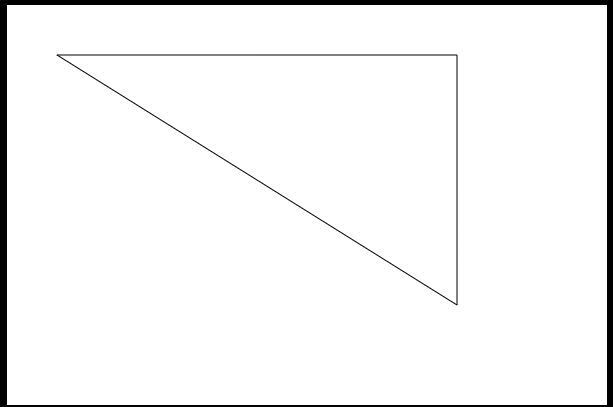
把上面的代码,稍微修改下,就能画出一个矩形了
 <style>

     body {

         background:#000;

     }

     #canvas {

         background:white;

     }

 </style>

 <script>

     window.onload = function(){

         var oCanvas = document.querySelector( "#canvas" ),

             oGc = oCanvas.getContext( '2d' );

         oGc.moveTo( 50, 50 );

         oGc.lineTo( 450, 50 );

         oGc.lineTo( 450, 300 );

         oGc.lineTo( 50, 300 );

         oGc.lineTo( 50, 50 );

         oGc.stroke();

     }

 </script>

 </head>

 <body>

 <canvas id="canvas" width="600" height="400"></canvas>

 </body>

二,canvas提供了画矩形的API
通过线条我们也能拼接出一个矩形,但是代码太多,每个点都要把握,显得比较麻烦,canvas为我们提供了画矩形的API,有两种,一种是描边矩形,一种是填充矩形.
cxt.strokeStyle = 属性值
cxt.strokeRect( x, y, width, height )
strokeStyle后面的属性是为了修饰线条的,主要包括( 颜色值,渐变色,图案 ),颜色支持英文单词,十六进制,RGB, RGBA格式的颜色设置.
strokeRect: x, y为矩形的左上角坐标,width和height为矩形的宽度和高度
     <script>

         window.onload = function(){

             var oCanvas = document.querySelector( "#canvas" ),

                 oGc = oCanvas.getContext( '2d' );

             oGc.strokeStyle = '#09f';

             oGc.strokeRect( 50, 50, 500, 300 );

         }

     </script>

     </head>

     <body>

     <canvas id="canvas" width="600" height="400"></canvas>

     </body>

填充矩形API
cxt.fillStyle = 属性值;
cxt.fillRect( x, y, width, height );
跟上面是一样的,只是把stoke换成了fill,fill就是填充的意思
画一个带有透明度的矩形:
 <script>

     window.onload = function(){

         var oCanvas = document.querySelector( "#canvas" ),

             oGc = oCanvas.getContext( '2d' );

         oGc.fillStyle = 'rgba( 255, 0, 0, 0.3 )';

         oGc.fillRect( 50, 50, 500, 300 );

     }

 </script>

 </head>

 <body>

 <canvas id="canvas" width="600" height="400"></canvas>

 </body>

另一种绘制矩形的API:cxt.rect( x, y, width, height );
他与strokeRect和fillRect有什么区别呢?
1,共同点:参数的意思相同
2,不同点,调用strokeRect和fillRect会立即绘制出矩形,而rect并不会,他需要调用stoke()或者fill()方法,才能把矩形绘制出来
 <script>

     window.onload = function(){

         var oCanvas = document.querySelector( "#canvas" ),

             oGc = oCanvas.getContext( '2d' );

         oGc.fillStyle = 'rgba( 255, 0, 0, 0.3 )';

         oGc.rect( 50, 50, 500, 300 );

         // oGc.stroke();

         oGc.fill();

     }

 </script>

 </head>

 <body>

 <canvas id="canvas" width="600" height="400"></canvas>

 </body>
清空矩形API:cxt.clearRect( x, y, width, height ); 参数跟strokeRect,fillRect意思一样
 <script>

     window.onload = function(){

         var oCanvas = document.querySelector( "#canvas" ),

             oGc = oCanvas.getContext( '2d' );

         oGc.fillStyle = 'rgba( 255, 0, 0, 0.3 )';

         oGc.fillRect( 50, 50, 500, 300 );

         oGc.clearRect( 100, 100, 200, 200 );

     }

 </script>

 </head>

 <body>

 <canvas id="canvas" width="600" height="400"></canvas>

 </body>

用fillRect和clearRect画一个加号,当然你可以用moveTo和lineTo,不过代码应该比这种方法多了不少.
 <script>

     window.onload = function(){

         var oCanvas = document.querySelector( "#canvas" ),

             oGc = oCanvas.getContext( '2d' );

         oGc.fillStyle = 'rgba( 255, 0, 0, 0.3 )';

         oGc.fillRect( 100, 100, 200, 200 );

         oGc.clearRect( 100, 100, 50, 50 );

         oGc.clearRect( 250, 100, 50, 50 );

         oGc.clearRect( 250, 250, 50, 50 );

         oGc.clearRect( 100, 250, 50, 50 );

     }

 </script>

 </head>

 <body>

 <canvas id="canvas" width="400" height="400"></canvas>

 </body>

绘制一个调色板:
 <style>

     body {

         background:#000;

     }

     #canvas {

         background:white;

     }

 </style>

 <script>

     window.onload = function(){

         var oCanvas = document.querySelector( "#canvas" ),

             oGc = oCanvas.getContext( '2d' ),

             aColor = [ '00', '33', '66', '99', 'cc', 'ff' ],

             aMiddle = [ 'ff', 'cc', '99', '66', '33', '00' ], count = 0;

         for( var i = 0; i < 12; i++ ){

             for( var j = 0; j < 18; j++ ){

                 count++;

                 if ( i < 6 && count < 6 && j < 6 )

                     oGc.fillStyle = `#${aColor[i]}${aMiddle[0]}${aColor[j]}`;

                 else if( i < 6 && count < 12 && j < 12 )

                     oGc.fillStyle = `#${aColor[i]}${aMiddle[1]}${aColor[j-6]}`;

                 else if ( i < 6 && count < 18 && j < 18 )

                     oGc.fillStyle = `#${aColor[i]}${aMiddle[2]}${aColor[j-12]}`;

                 else if ( count < 6 && j < 6 )

                     oGc.fillStyle = `#${aColor[i-6]}${aMiddle[3]}${aColor[j]}`;

                 else if ( count < 12 && j < 12 )

                     oGc.fillStyle = `#${aColor[i-6]}${aMiddle[4]}${aColor[j-6]}`;

                 else if ( count < 18 && j < 18 )

                     oGc.fillStyle = `#${aColor[i-6]}${aMiddle[5]}${aColor[j-12]}`;

                 oGc.fillRect( j * 40, i * 40, 40, 40 );

             }

             count = 0;

         }

     }

 </script>

 </head>

 <body>

 <canvas id="canvas" width="720" height="720"></canvas>

 </body>
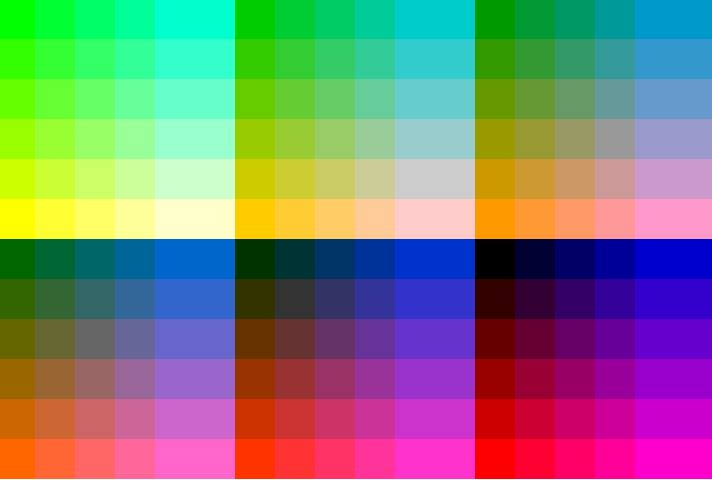
javascript原生实现调色板:
var aColor = [ '00', '33', '66', '99', 'cc', 'ff' ],
aMiddle = [ 'ff', 'cc', '99', '66', '33','00' ]; document.write( "<table>" );
for( var i = 0; i < 12; i++ ){
document.write( "<tr>" );
for( var j = 0 ; j < 18; j++ ) {
if ( i < 6 && j < 6 ) //前6行,左6列
document.write( "<td style='background-color:#" + aColor[i]+ aMiddle[0] + aColor[j] + "'> </td>" );
else if ( i < 6 && j < 12 ){ //前6行 中间6列
document.write( "<td style='background-color:#" + aColor[i]+ aMiddle[1] + aColor[j-6] + "'> </td>" );
}else if ( i < 6 && j < 18 ){ //前6行, 后面6列
document.write( "<td style='background-color:#" + aColor[i]+ aMiddle[2] + aColor[j-12] + "'> </td>" );
}else if ( i < 12 && j < 6 ){ //后6行, 左6列
document.write( "<td style='background-color:#" + aColor[i-6]+ aMiddle[3] + aColor[j] + "'> </td>" );
}else if ( i < 12 && j < 12 ){ //后6行, 中6列
document.write( "<td style='background-color:#" + aColor[i-6]+ aMiddle[4] + aColor[j-6] + "'> </td>" );
}else if ( i < 12 && j < 18 ){ //后6行, 后6列
document.write( "<td style='background-color:#" + aColor[i-6]+ aMiddle[5] + aColor[j-12] + "'> </td>" );
}
}
document.write( "</tr>" );
}
document.write( "</table>" );
[js高手之路] html5 canvas系列教程 - 掌握画直线图形的常用API的更多相关文章
- [js高手之路] html5 canvas系列教程 - arcTo(弧度与二次,三次贝塞尔曲线以及在线工具)
之前,我写了一个arc函数的用法:[js高手之路] html5 canvas系列教程 - arc绘制曲线图形(曲线,弧线,圆形). arcTo: cxt.arcTo( cx, cy, x2, y2, ...
- [js高手之路] html5 canvas系列教程 - arc绘制曲线图形(曲线,弧线,圆形)
绘制曲线,经常会用到路径的知识,如果你对路径有疑问,可以参考我的这篇文章[js高手之路] html5 canvas系列教程 - 开始路径beginPath与关闭路径closePath详解. arc:画 ...
- [js高手之路] html5 canvas系列教程 - 图片操作(drawImage,clip,createPattern)
接着上文[js高手之路] html5 canvas系列教程 - 文本样式(strokeText,fillText,measureText,textAlign,textBaseline)继续,本文介绍的 ...
- [js高手之路] html5 canvas系列教程 - 文本样式(strokeText,fillText,measureText,textAlign,textBaseline)
接着上文线条样式[js高手之路] html5 canvas系列教程 - 线条样式(lineWidth,lineCap,lineJoin,setLineDash)继续. canvas提供两种输出文本的方 ...
- [js高手之路] html5 canvas系列教程 - 线条样式(lineWidth,lineCap,lineJoin,setLineDash)
上文,写完弧度与贝塞尔曲线[js高手之路] html5 canvas系列教程 - arcTo(弧度与二次,三次贝塞尔曲线以及在线工具),本文主要是关于线条的样式设置 lineWidth: 设置线条的宽 ...
- [js高手之路] html5 canvas系列教程 - 像素操作(反色,黑白,亮度,复古,蒙版,透明)
接着上文[js高手之路] html5 canvas系列教程 - 状态详解(save与restore),相信大家都应该玩过美颜功能,而我们今天要讲的就是canvas强大的像素处理能力,通过像素处理,实现 ...
- [js高手之路] html5 canvas系列教程 - 状态详解(save与restore)
本文内容与路径([js高手之路] html5 canvas系列教程 - 开始路径beginPath与关闭路径closePath详解)是canvas中比较重要的概念.掌握理解他们是做出复杂canvas动 ...
- [js高手之路] html5 canvas系列教程 - 线形渐变,径向渐变与阴影设置
接着上文[js高手之路] html5 canvas系列教程 - 像素操作(反色,黑白,亮度,复古,蒙版,透明)继续. 一.线形渐变 线形渐变指的是一条直线上发生的渐变. 用法: var linear ...
- [js高手之路] html5 canvas系列教程 - 认识canvas以及基本使用方法
canvas是html5中引入的一个新元素,俗称画布,既然是画布,当然是用来画图的.canvas技术指的是利用javascript操作canvas元素绘制图形的技术,要使用canvas,一定要浏览器支 ...
随机推荐
- Extjs6获取Grid里的数据(数据源)
{ xtype: 'grid', sortableColumns: false, reference: 'grid', flex: 1, store: 'panoram.Panoram', colum ...
- redux源码解读
react在做大型项目的时候,前端的数据一般会越来越复杂,状态的变化难以跟踪.无法预测,而redux可以很好的结合react使用,保证数据的单向流动,可以很好的管理整个项目的状态,但是具体来说,下面是 ...
- redis 安装及启动关闭
1.redis下载 方式1:直接去官网下载 https://redis.io/download 方式2:通过命令下载 wget http://download.redis.io/releases/re ...
- 增强遍历和Object多参数遍历
public class T2 { public void t1(Object o){//Object是任何类型,多态 System.out.println(o.toString()); } publ ...
- Cognos报表调度与作业管理
本文针对Cognos的报表调度和作业管理做案例分析.为了测试报表定时调度功能,本文将报表定时输出到指定的归档目录. 1. 测试环境 Cognos V11.0 2. 设置档案文件根目录 Cognos报 ...
- hashlib使用时出现: Unicode-objects must be encoded before hashing
# hashlib.md5(data)函数中,data参数的类型应该是bytes# hash前必须把数据转换成bytes类型>>> from hashlib import md5 F ...
- Linux的netstat查看端口是否开放见解(0.0.0.0与127.0.0.1的区别)
linux运维都需要对端口开放查看 netstat 就是对端口信息的查看 # netstat -nltp p 查看端口挂的程序 [root@iz2ze5is23zeo1ipvn65aiz ~]# n ...
- JUnit 3.8.1 源码学习
JUnit 3.8.1 源码学习 环境搭建(源码加载配置) 由于IDE自身含有JUint插件,因此通过正常途径是没有源码加载入口的,因此需通过手动加载扩展JAR,然后再添加对应源码JAR,如图:项目右 ...
- vs 2015 rdlc报表绑定datagridview中的数据
这几天一直想要实现rdlc报表绑定datagridview中的数据,始终在虚拟表向rdlc报表绑定这一步上出错.今天从下午4点到七点四十一直在尝试.最终还是实现了,最然并不知所以然,这个问题还是以后在 ...
- 用webgl打造自己的3D迷宫游戏
用webgl打造自己的3D迷宫游戏 2016/09/19 · JavaScript · WebGL 原文出处: AlloyTeam 背景:前段时间自己居然迷路了,有感而发就想到写一个可以让人迷路 ...