mysqld_exporter监控mysql信息
mysqld_exporter监控mysql信息
一、背景
使用 mysqld_exporter 来抓取 mysql的一些指标信息。
二、prometheus接入mysqld_exporter
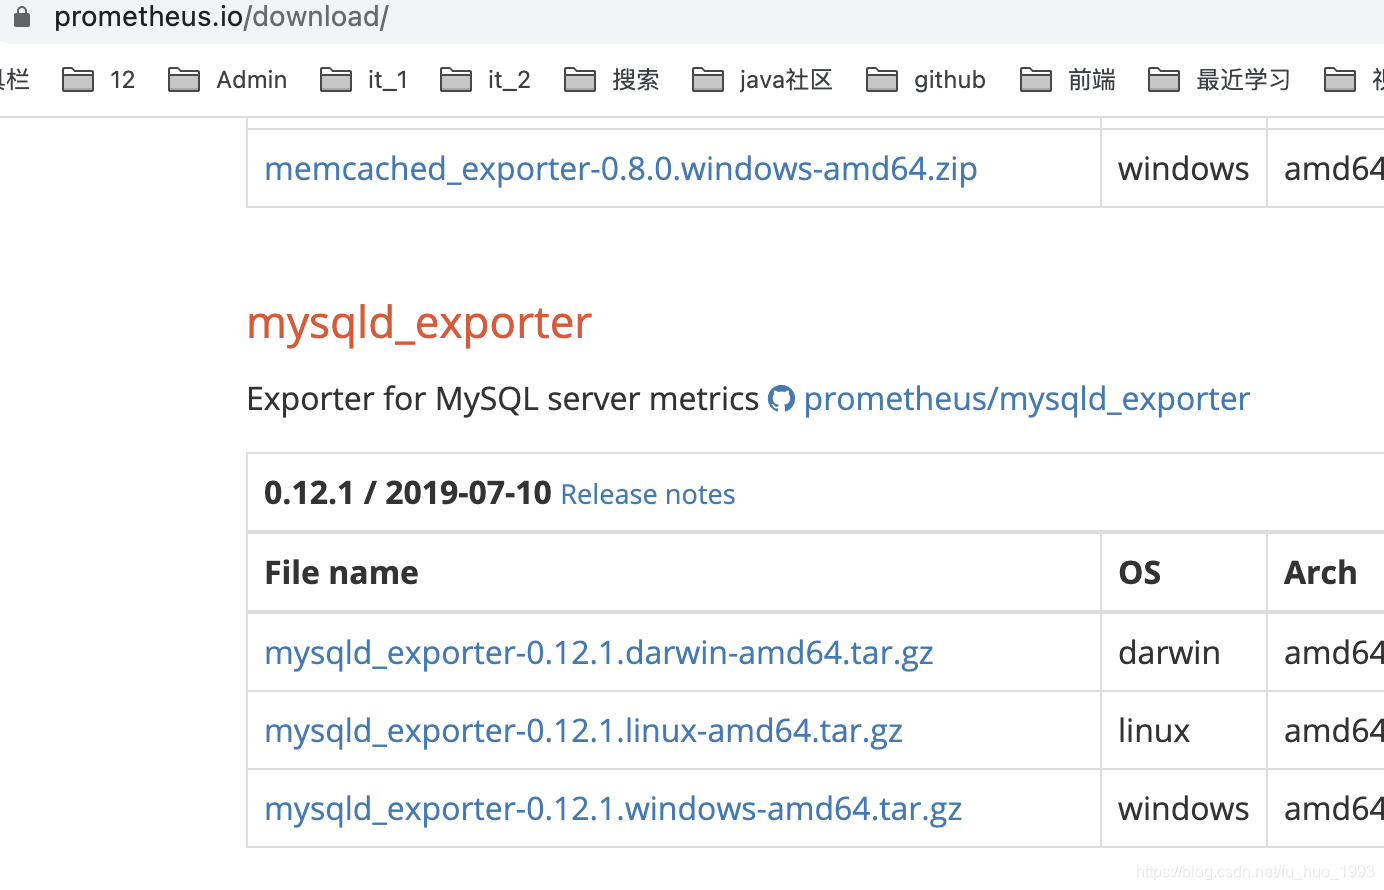
1、安装mysqld_exporter
# 下载 mysqld_exporter

wget https://github.com/prometheus/mysqld_exporter/releases/download/v0.12.1/mysqld_exporter-0.12.1.darwin-amd64.tar.gz

# 解压 并 重命名

tar -zxvf mysqld_exporter-0.12.1.darwin-amd64.tar.gz

mv mysqld_exporter-0.12.1.darwin-amd64 mysqld_exporter
2、创建mysqld_exporter用户并授权
CREATE USER 'mysqld_exporter'@'localhost' IDENTIFIED BY 'mysqldExporter1993' WITH MAX_USER_CONNECTIONS 3;

GRANT PROCESS, REPLICATION CLIENT, SELECT ON *.* TO 'mysqld_exporter'@'localhost';
注意:
在创建用户的时候,推荐执行 MAX_USER_CONNECTIONS参数,避免我们监控使用过多的数据库连接数,导致数据库压力过大。
3、创建 my.cnf 配置文件
在和mysqld_exporter文件同级的文件夹中创建my.cnf文件,文件内容如下。
[client]

user=mysqld_exporter

password=mysqldExporter1993

host=localhost

port=3306
4、启动mysqld_exporter
nohup /Users/huan/soft/prometheus/mysqld_exporter/mysqld_exporter \

--config.my-cnf="/Users/huan/soft/prometheus/mysqld_exporter/my.cnf" \

--web.listen-address="0.0.0.0:9088" \

--log.level=debug \

> logs/mysqld_exporter.out 2>&1 &
参数解释:
| 参数 | 解释 |
|---|---|
| –config.config.my-cnf | 指定配置文件的路径 |
| –web.listen-address | 指定监听的地址,端口 |
| –log.level | 指定日志级别 |
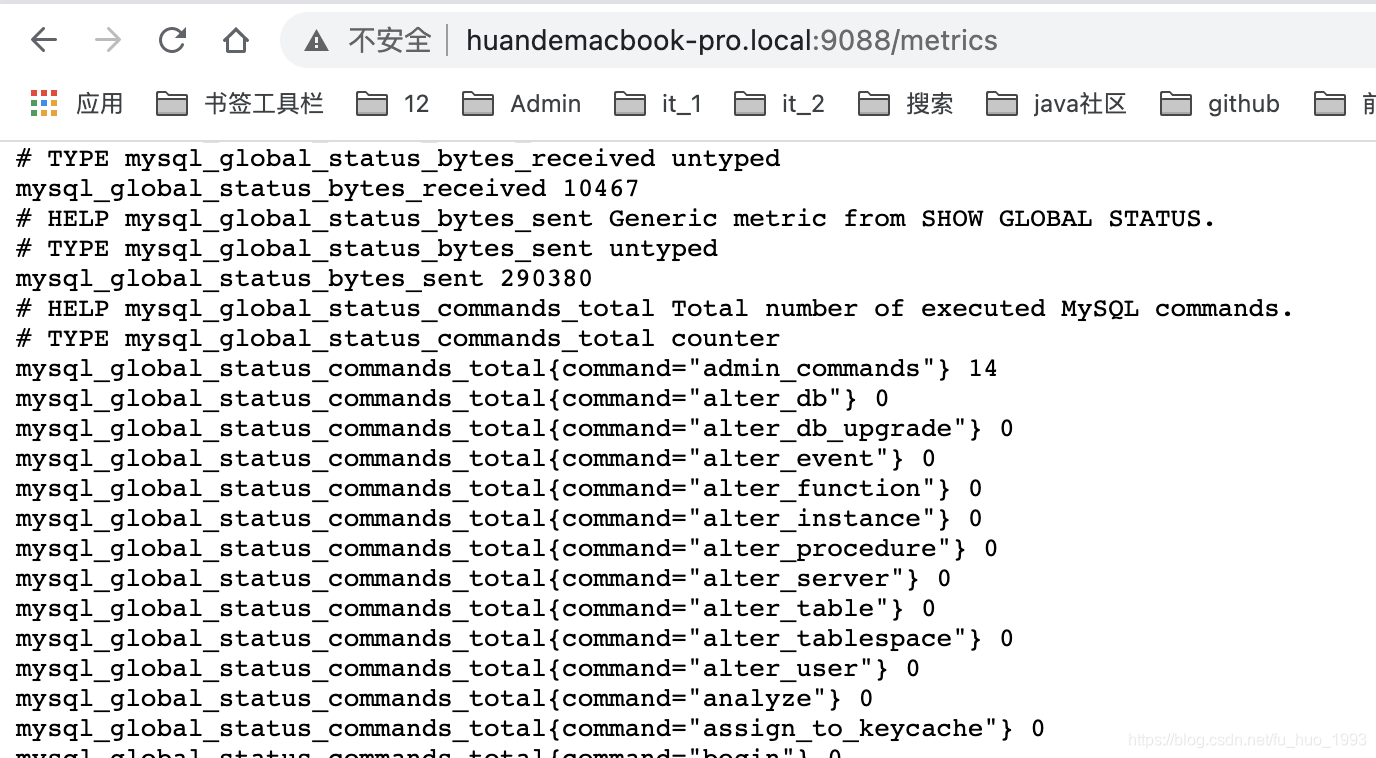
5、查看抓取的mysql指标信息
http://localhost:9088/metrics
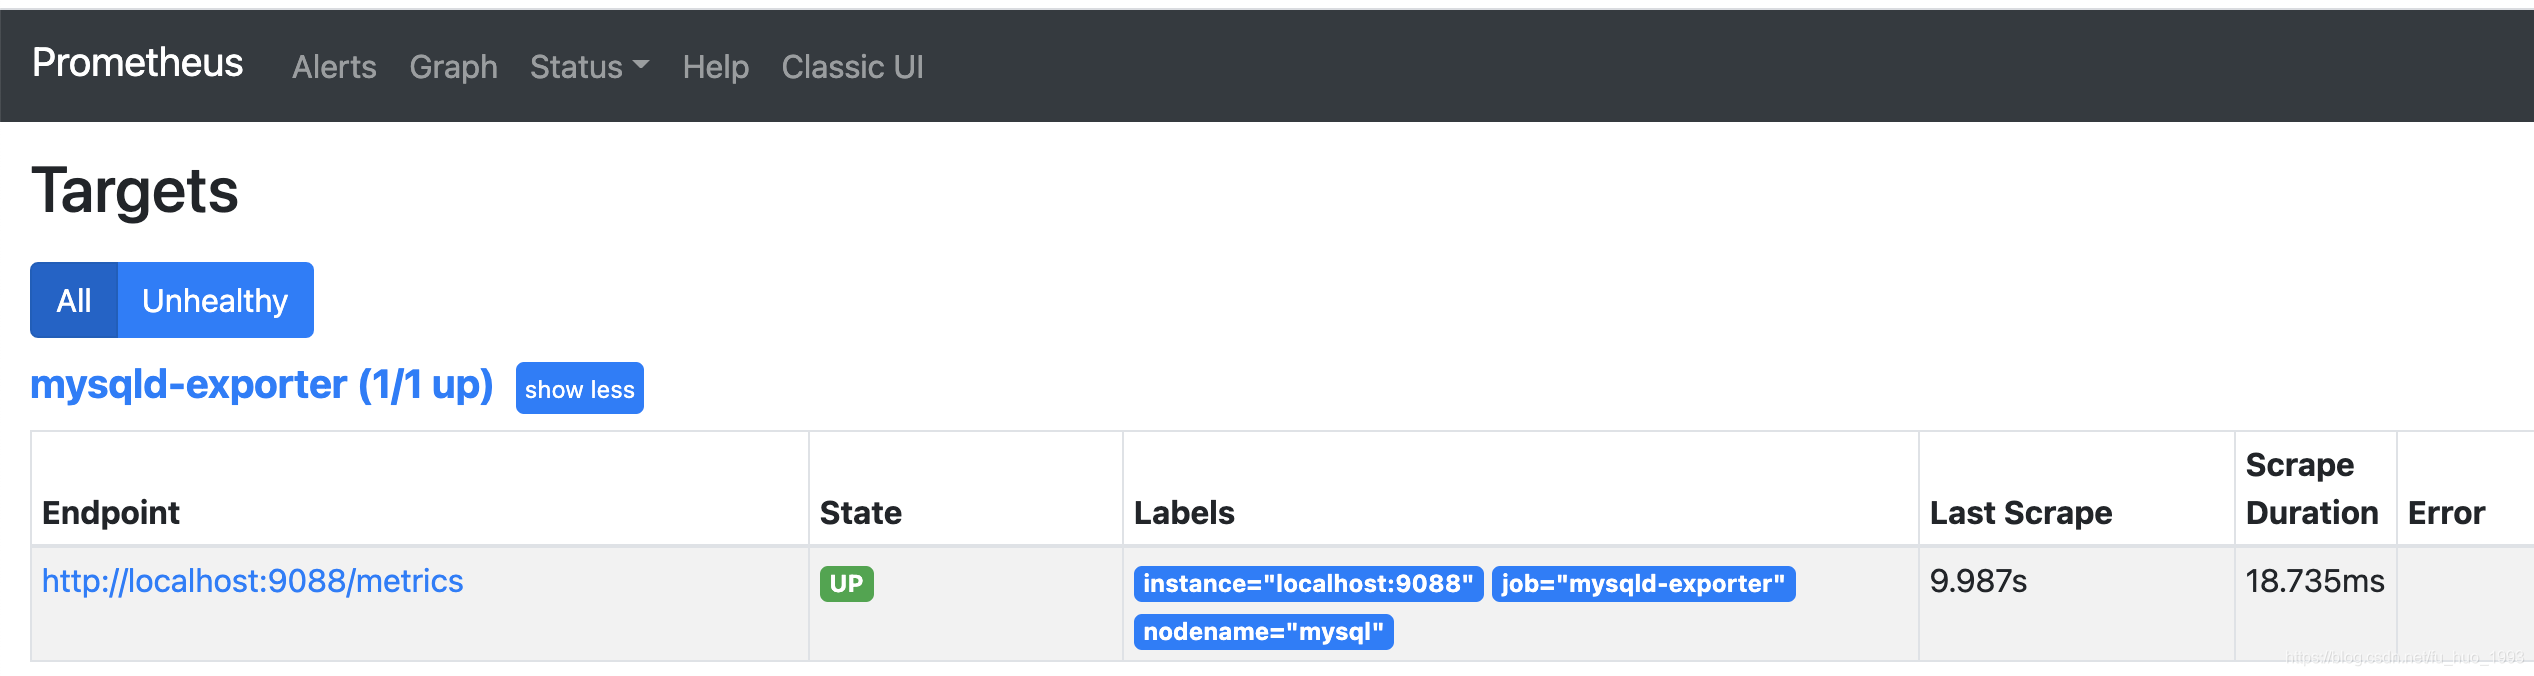
6、接入到prometheus中
scrape_configs:

  - job_name: 'mysqld-exporter'

    static_configs:

    - targets: ['localhost:9088']

      labels:

        nodename: 'mysql'
三、部分告警指标
groups:

- name: GaleraAlerts

  rules:

  - alert: MySQLGaleraNotReady

    expr: mysql_global_status_wsrep_ready != 1

    for: 5m

    labels:

      severity: warning

    annotations:

      description: '{{$labels.job}} on {{$labels.instance}} is not ready.'

      summary: Galera cluster node not ready

  - alert: MySQLGaleraOutOfSync

    expr: (mysql_global_status_wsrep_local_state != 4 and mysql_global_variables_wsrep_desync

      == 0)

    for: 5m

    labels:

      severity: warning

    annotations:

      description: '{{$labels.job}} on {{$labels.instance}} is not in sync ({{$value}}

        != 4).'

      summary: Galera cluster node out of sync

  - alert: MySQLGaleraDonorFallingBehind

    expr: (mysql_global_status_wsrep_local_state == 2 and mysql_global_status_wsrep_local_recv_queue

      > 100)

    for: 5m

    labels:

      severity: warning

    annotations:

      description: '{{$labels.job}} on {{$labels.instance}} is a donor (hotbackup)

        and is falling behind (queue size {{$value}}).'

      summary: xtradb cluster donor node falling behind

  - alert: MySQLReplicationNotRunning

    expr: mysql_slave_status_slave_io_running == 0 or mysql_slave_status_slave_sql_running

      == 0

    for: 2m

    labels:

      severity: critical

    annotations:

      description: Slave replication (IO or SQL) has been down for more than 2 minutes.

      summary: Slave replication is not running

  - alert: MySQLReplicationLag

    expr: (instance:mysql_slave_lag_seconds > 30) and on(instance) (predict_linear(instance:mysql_slave_lag_seconds[5m],

      60 * 2) > 0)

    for: 1m

    labels:

      severity: critical

    annotations:

      description: The mysql slave replication has fallen behind and is not recovering

      summary: MySQL slave replication is lagging

  - alert: MySQLReplicationLag

    expr: (instance:mysql_heartbeat_lag_seconds > 30) and on(instance) (predict_linear(instance:mysql_heartbeat_lag_seconds[5m],

      60 * 2) > 0)

    for: 1m

    labels:

      severity: critical

    annotations:

      description: The mysql slave replication has fallen behind and is not recovering

      summary: MySQL slave replication is lagging

  - alert: MySQLInnoDBLogWaits

    expr: rate(mysql_global_status_innodb_log_waits[15m]) > 10

    labels:

      severity: warning

    annotations:

      description: The innodb logs are waiting for disk at a rate of {{$value}} /

        second

      summary: MySQL innodb log writes stalling
参考连接:https://github.com/prometheus/mysqld_exporter/blob/master/mysqld-mixin/alerts/galera.yaml
四、参考链接
1、mysqld_exporter的github地址
2、mysql的部分告警编写
mysqld_exporter监控mysql信息的更多相关文章
- Grafan+Prometheus 监控 MySQL
架构图 环境 IP 环境 需装软件 192.168.0.237 mysql-5.7.20 node_exporter-0.15.2.linux-amd64.tar.gz mysqld_exporter ...
- 使用Prometheus+Grafana监控MySQL实践
一.介绍Prometheus Prometheus(普罗米修斯)是一套开源的监控&报警&时间序列数据库的组合,起始是由SoundCloud公司开发的.随着发展,越来越多公司和组织接受采 ...
- 采用prometheus 监控mysql
1. prometheus 是什么 开源的系统监控和报警工具,监控项目的流量.内存量.负载量等实时数据. 它通过直接或短时jobs中介收集监控数据,在本地存储所有收集到的数据,并且通过定义好的rule ...
- Grafana+Prometheus 监控 MySQL
转自:Grafana+Prometheus 监控 MySQL 架构图 环境 IP 环境 需装软件 192.168.0.237 mysql-5.7.20 node_exporter-0.15.2.lin ...
- Prometheus 监控Mysql服务器及Grafana可视化
Prometheus 监控Mysql服务器及Grafana可视化. mysql_exporter:用于收集MySQL性能信息. 使用版本 mysqld_exporter 0.11.0 官方地址 使用文 ...
- Prometheus 监控MySQL
目录 0.简介 1.mysql_exporter部署 2.mysql报警规则 0.简介 文中主要监控MySQL/MySQL主从信息 版本:mysql-5.7,mysql_exporter-0.12.1 ...
- mysqld_exporter的源码分析和定制化(单个mysqld_exporter监控多个数据库实例)
mysqld_exporter是prometheus官方提供的用于监控mysql运行状态的exporter.其相关信息可以参考:https://github.com/prometheus/mysqld ...
- 【DB宝41】监控利器PMM的使用--监控MySQL、PG、MongoDB、ProxySQL等
目录 一.PMM简介 二.安装使用 三.监控MySQL数据库 MySQL慢查询分析 四.监控PG数据库 五.监控MongoDB数据库 六.监控ProxySQL中间件 一.PMM简介 之前发布过一篇Pr ...
- 【Prometheus+Grafana系列】监控MySQL服务
前言 前面的一篇文章已经介绍了 docker-compose 搭建 Prometheus + Grafana 服务.当时实现了监控服务器指标数据,是通过 node_exporter.Prometheu ...
随机推荐
- Redis哨兵机制的实现及与SpringBoot的整合
1. 概述 前面我们聊过Redis的读写分离机制,这个机制有个致命的弱点,就是主节点(Master)是个单点,如果主节点宕掉,整个Redis的写操作就无法进行服务了. 为了解决这个问题,就需要依靠&q ...
- Toast控件
------------恢复内容开始------------ 四种常见的App弹窗设计:Toast.Dialog.Actionbar 和 Snackbar 弹窗又称为对话框,是App与用户进行交互的常 ...
- aes加解密前后端-前端
一.ajax请求前端 f12请求和响应参数效果: 1.在前端封装ajax的公共Util的js中,封装ajax请求的地方,在beforeSend方法和成功之后的回调函数success方法中: var p ...
- TypeScript 中命名空间与模块的理解?区别?
一.模块 TypeScript 与ECMAScript 2015 一样,任何包含顶级 import 或者 export 的文件都被当成一个模块 相反地,如果一个文件不带有顶级的import或者expo ...
- 【第十七篇】- Maven Web 应用之Spring Cloud直播商城 b2b2c电子商务技术总结
Maven Web 应用 本章节我们将学习如何使用版本控制系统 Maven 来管理一个基于 web 的项目,如何创建.构建.部署已经运行一个 web 应用. 创建 Web 应用 我们可以使用 mave ...
- 洛谷P1603——斯诺登的密码(字符串处理)
https://www.luogu.org/problem/show?pid=1603#sub 题目描述 2013年X月X日,俄罗斯办理了斯诺登的护照,于是他混迹于一架开往委内瑞拉的飞机.但是,这件事 ...
- linux新安装了php,但是使用mysqli连接数据库一直超时
centos7+mysql5.5+php5.6+nginx mysql php nginx都安装完成,然后启动了,网站也运行, 但是php文件中使用mysqli_connect时一直超时,有时也报错, ...
- Java项目常用的统一返回跟统一异常处理
先创建一个crud的项目. controller调用service调用mapper 以下以简单代码代替 controller @GetMapping("/getUserById") ...
- python学习笔记(十五)-unittest单元测试的一个框架
unittest 单元测试的一个框架什么框架 一堆工具的集合. TestCase TestSuite 测试套件,多个用例在一起 TestLoader是用来加载TestCase到TestSuite中的 ...
- 『GoLang』函数
函数介绍 Go语言函数基本组成包括: 关键字func 函数名 参数列表 返回值 函数体 返回语句 语法如下: func 函数名(参数列表) (返回值列表) { // 函数体 return } 除了ma ...