吴裕雄 python 机器学习——密度聚类DBSCAN模型
import numpy as np

import matplotlib.pyplot as plt

from sklearn import  cluster

from sklearn.metrics import adjusted_rand_score

from sklearn.datasets.samples_generator import make_blobs

def create_data(centers,num=100,std=0.7):

    X, labels_true = make_blobs(n_samples=num, centers=centers, cluster_std=std)

    return  X,labels_true

#密度聚类DBSCAN模型

def test_DBSCAN(*data):

    X,labels_true=data

    clst=cluster.DBSCAN()

    predicted_labels=clst.fit_predict(X)

    print("ARI:%s"% adjusted_rand_score(labels_true,predicted_labels))

    print("Core sample num:%d"%len(clst.core_sample_indices_))

# 用于产生聚类的中心点

centers=[[1,1],[2,2],[1,2],[10,20]]

# 产生用于聚类的数据集

X,labels_true=create_data(centers,1000,0.5)

#  调用 test_DBSCAN 函数

test_DBSCAN(X,labels_true)
def test_DBSCAN_epsilon(*data):

    '''

    测试 DBSCAN 的聚类结果随  eps 参数的影响

    '''

    X,labels_true=data

    epsilons=np.logspace(-1,1.5)

    ARIs=[]

    Core_nums=[]

    for epsilon in epsilons:

        clst=cluster.DBSCAN(eps=epsilon)

        predicted_labels=clst.fit_predict(X)

        ARIs.append( adjusted_rand_score(labels_true,predicted_labels))

        Core_nums.append(len(clst.core_sample_indices_))

    ## 绘图

    fig=plt.figure()

    ax=fig.add_subplot(1,2,1)

    ax.plot(epsilons,ARIs,marker='+')

    ax.set_xscale('log')

    ax.set_xlabel(r"$\epsilon$")

    ax.set_ylim(0,1)

    ax.set_ylabel('ARI')

    ax=fig.add_subplot(1,2,2)

    ax.plot(epsilons,Core_nums,marker='o')

    ax.set_xscale('log')

    ax.set_xlabel(r"$\epsilon$")

    ax.set_ylabel('Core_Nums')

    fig.suptitle("DBSCAN")

    plt.show()

#  调用 test_DBSCAN_epsilon 函数

test_DBSCAN_epsilon(X,labels_true)

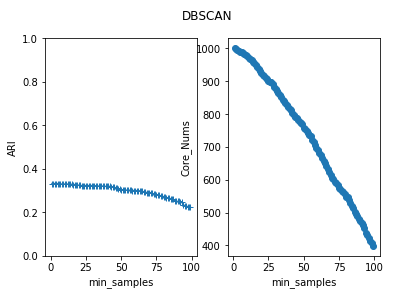
def test_DBSCAN_min_samples(*data):

    '''

    测试 DBSCAN 的聚类结果随  min_samples 参数的影响

    '''

    X,labels_true=data

    min_samples=range(1,100)

    ARIs=[]

    Core_nums=[]

    for num in min_samples:

        clst=cluster.DBSCAN(min_samples=num)

        predicted_labels=clst.fit_predict(X)

        ARIs.append( adjusted_rand_score(labels_true,predicted_labels))

        Core_nums.append(len(clst.core_sample_indices_))

    ## 绘图

    fig=plt.figure()

    ax=fig.add_subplot(1,2,1)

    ax.plot(min_samples,ARIs,marker='+')

    ax.set_xlabel( "min_samples")

    ax.set_ylim(0,1)

    ax.set_ylabel('ARI')

    ax=fig.add_subplot(1,2,2)

    ax.plot(min_samples,Core_nums,marker='o')

    ax.set_xlabel( "min_samples")

    ax.set_ylabel('Core_Nums')

    fig.suptitle("DBSCAN")

    plt.show()

#  调用 test_DBSCAN_min_samples 函数

test_DBSCAN_min_samples(X,labels_true)
吴裕雄 python 机器学习——密度聚类DBSCAN模型的更多相关文章
- 吴裕雄 python 机器学习——层次聚类AgglomerativeClustering模型
import numpy as np import matplotlib.pyplot as plt from sklearn import cluster from sklearn.metrics ...
- 吴裕雄 python 机器学习——支持向量机非线性回归SVR模型
import numpy as np import matplotlib.pyplot as plt from sklearn import datasets, linear_model,svm fr ...
- 吴裕雄 python 机器学习——KNN回归KNeighborsRegressor模型
import numpy as np import matplotlib.pyplot as plt from sklearn import neighbors, datasets from skle ...
- 吴裕雄 python 机器学习——KNN分类KNeighborsClassifier模型
import numpy as np import matplotlib.pyplot as plt from sklearn import neighbors, datasets from skle ...
- 吴裕雄 python 机器学习——半监督学习LabelSpreading模型
import numpy as np import matplotlib.pyplot as plt from sklearn import metrics from sklearn import d ...
- 吴裕雄 python 机器学习——支持向量机线性回归SVR模型
import numpy as np import matplotlib.pyplot as plt from sklearn import datasets, linear_model,svm fr ...
- 吴裕雄 python 机器学习——混合高斯聚类GMM模型
import numpy as np import matplotlib.pyplot as plt from sklearn import mixture from sklearn.metrics ...
- 吴裕雄 python 机器学习——K均值聚类KMeans模型
import numpy as np import matplotlib.pyplot as plt from sklearn import cluster from sklearn.metrics ...
- 吴裕雄 python 机器学习——分类决策树模型
import numpy as np import matplotlib.pyplot as plt from sklearn import datasets from sklearn.model_s ...
随机推荐
- 外网访问vmvare
使用端口映射即可,以tplink wr886n为例, 方法如下: 1.打开浏览器,输入默认ip192.168.0.1回车登录: 2.登录对话框,输入 密码点击确定: 3.点击转发规则--虚拟服务器,点 ...
- java中链表的数据(对象)位置交换
用LinkedList类的set方法把引用 对象换了就行 ,如 import java.util.LinkedList; public class Tffdsafsdafsad { public st ...
- iframe 模拟ajax文件上传and formdata ajax 文件上传
对于文件上传 有好多种方式,一直想总结 文件上传的方法 今天就来写下 iframe 的文件上传的代码 本人语言表达能里有限,不多说了 直接上代码. 首先看 总体页面. 总共就三个文件. 实际上也就是 ...
- 4、MemorySubSystem
1.概述 S3C6410X存储器子系统包括7个存储器控制器,SROM控制器,两个OneNAND控制器,一个NAND Flash控制器,一个CF控制器,一个DRAM控制器.静态存储器控制器,oneNAN ...
- rest 参数和扩展运算符
rest 参数和扩展运算符 rest 参数的形式为 ...变量名:扩展运算符是三个点 .... rest 参数 function add(...values) { console.log(values ...
- What is the AppData folder?
Applies to Windows 8.1, Windows RT 8.1 The AppData folder contains app settings, files, and data spe ...
- (转)jQuery基础之选择器
原文地址: http://www.cnblogs.com/webmoon/p/3169360.html 选择器是jQuery的根基,在jQuery中,对事件处理.遍历DOM和Ajax操作都依赖于选择器 ...
- 如何将一个用utf-8编码的文本用java程序转换成ANSI编码的文本
jdk有一个关于UTF-8的bug所以加了一句 br.skip(1); bugID: http://bugs.java.com/view_bug.do?bug_id=4508058 public st ...
- HTML5移动应用开发入门经典 中文pdf扫描版
HTML5是关注度ZUI高的前沿Web技术,而移动互联网则是近两年ZUI炙手可热的Web领域.<HTML5移动应用开发入门经典>将这两者巧妙结合起来,详细讲解了如何利用HTML5进行移动应 ...
- Go语言最佳实践——面向对象
对于接口,应使用组合而非继承的方式扩展: 对于结构体,应定义独立的结构体,而非用嵌套模拟继承. 值接收者和指针接收者: 1.对于不可变类型创建只接受值接收者的方法,而为可变的类型创建接受指针接收者的方 ...