Python使用Plotly绘图工具,绘制散点图、线形图
今天在研究Plotly绘制散点图的方法
使用Python3.6 + Plotly
Plotly版本2.0.0
在开始之前先说说,还需要安装库Numpy,安装方法在我的另一篇博客中有写到:https://www.cnblogs.com/ws17345067708/p/10531531.html
因为Plotly没有自己独立的线性图形函数,所以把线性图形与散点图形全部用一个函数实现
这个函数是Scatter函数
下面举几个简单的例子
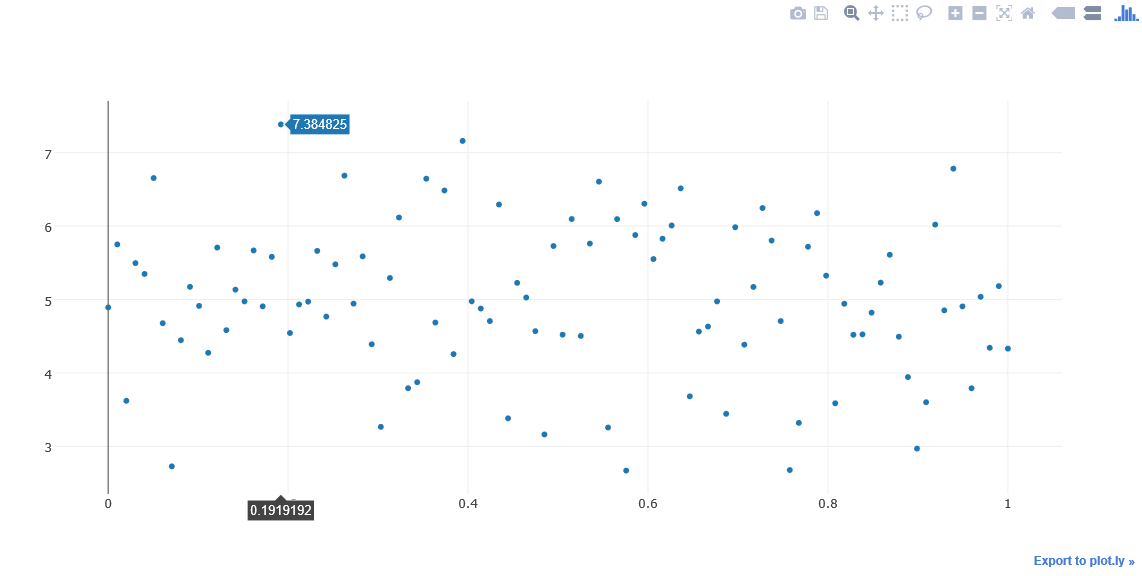
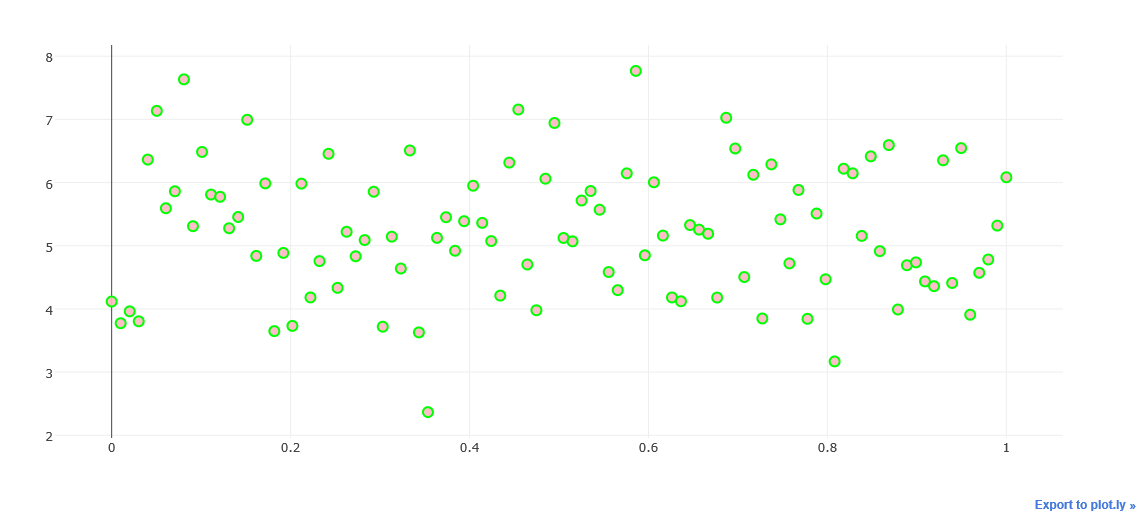
先画一个纯散点图,代码如下:
import plotly

import plotly.graph_objs as go

import numpy

pyplt = plotly.offline.plot #使用离线模式

N = 100

random_x = numpy.linspace(0, 1, N)

random_y0 = numpy.random.randn(N)+5

random_y1 = numpy.random.randn(N)

random_y2 = numpy.random.randn(N)-5

#上面是一些随机数据

trace0 = go.Scatter(

    x = random_x,

    y = random_y0,

    mode = 'markers', # 绘制纯散点图

    name = 'markers' # 图例名称

)

data = [trace0]

pyplt(data, filename='tmp/scatter_diagram.html')#html放置的位置
运行程序会得到如下图所示图形
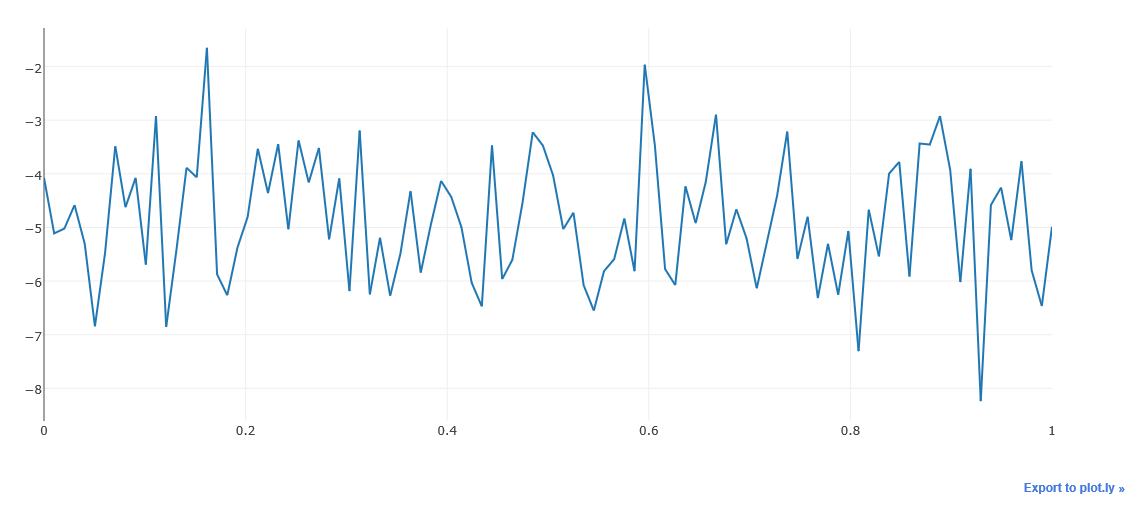
接下来我们画一个线性图,数据还是之前的数据。看看是什么样子,代码如下
import plotly

import plotly.graph_objs as go

import numpy

pyplt = plotly.offline.plot #使用离线模式

N = 100

random_x = numpy.linspace(0, 1, N)

random_y0 = numpy.random.randn(N)+5

random_y1 = numpy.random.randn(N)

random_y2 = numpy.random.randn(N)-5

trace1 = go.Scatter(

    x = random_x,

    y = random_y2,

    mode = 'lines', # 线性图

    name = 'lines'

)

data = [trace1]

pyplt(data, filename='tmp/line.html')
我们会得到如下图所示的线形图
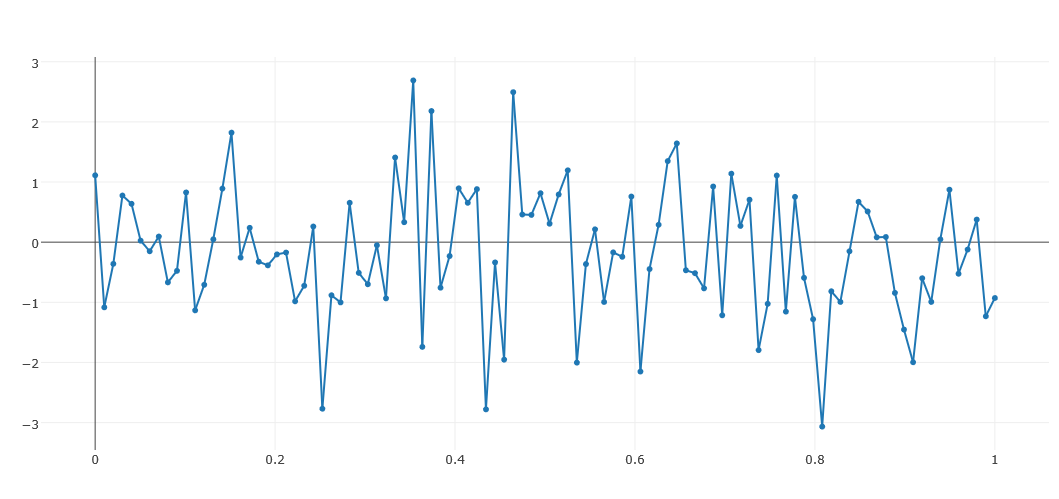
下面我们把线性图,和散点图合到一起
import plotly

import plotly.graph_objs as go

import numpy

pyplt = plotly.offline.plot #使用离线模式

N = 100

random_x = numpy.linspace(0, 1, N)

random_y0 = numpy.random.randn(N)+5

random_y1 = numpy.random.randn(N)

random_y2 = numpy.random.randn(N)-5

trace1 = go.Scatter(

    x = random_x,

    y = random_y1,

    mode = 'lines+markers', # 散点+线的绘图

    name = 'lines+markers'

)

data = [trace1]

pyplt(data, filename='tmp/add.html')
得到如下图所示图例
三个图在一张图中表示的例子
import plotly

import plotly.graph_objs as go

import numpy

pyplt = plotly.offline.plot #使用离线模式

N = 100

random_x = numpy.linspace(0, 1, N)

random_y0 = numpy.random.randn(N)+5

random_y1 = numpy.random.randn(N)

random_y2 = numpy.random.randn(N)-5

trace0 = go.Scatter(

    x = random_x,

    y = random_y0,

    mode = 'markers', # 纯散点的绘图

    name = 'markers' # 曲线名称

)

trace1 = go.Scatter(

    x = random_x,

    y = random_y1,

    mode = 'lines+markers', # 散点+线的绘图

    name = 'lines+markers'

)

trace2 = go.Scatter(

    x = random_x,

    y = random_y2,

    mode = 'lines', # 线的绘图

    name = 'lines'

)

data = [trace0,trace1,tarace2]

pyplt(data, filename='tmp/all.html')
得到如下图
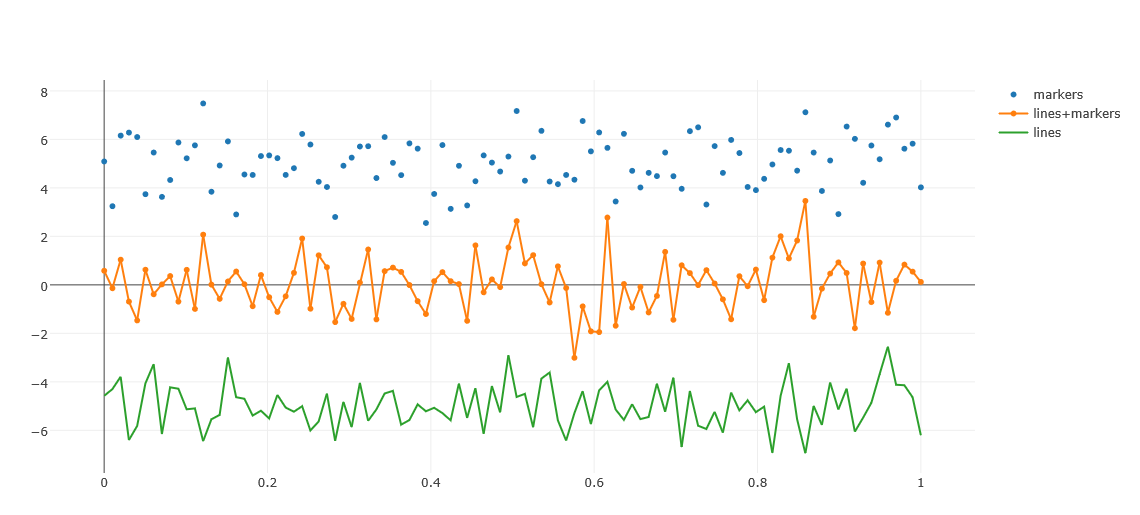
可以看到,三个图,绘制在一张图上了!
也可以对样式进行设置下面看个例子,改变一下颜色,代码如下:
import plotly

import plotly.graph_objs as go

import numpy

pyplt = plotly.offline.plot #使用离线模式

N = 100

random_x = numpy.linspace(0, 1, N)

random_y0 = numpy.random.randn(N)+5

random_y1 = numpy.random.randn(N)

random_y2 = numpy.random.randn(N)-5

trace0 = go.Scatter(

    x = random_x,

    y = random_y0,

    mode = 'markers', # 纯散点图

    name = 'markers', # 曲线名称

    marker = dict(

        size = 10, # 设置点的宽度

        color = 'rgba(255, 182, 193, .9)', #设置曲线的颜色

        line = dict(

            width = 2, # 设置线条的宽度

            color = 'rgb(0, 255, 0)' #设置线条的颜色

        )

    )

)

data = [trace0]

pyplt(data, filename='tmp/style.html')
marker的参数设置很重要,设置颜色color,大小size
line设置线条宽度width,color 设置线条颜色等
Python使用Plotly绘图工具,绘制散点图、线形图的更多相关文章
- Python使用Plotly绘图工具,绘制面积图
今天我们来讲一下如何使用Python使用Plotly绘图工具,绘制面积图 绘制面积图与绘制散点图和折线图的画法类似,使用plotly graph_objs 中的Scatter函数,不同之处在于面积图对 ...
- Python使用Plotly绘图工具,绘制直方图
今天我们再来讲解一下Python使用Plotly绘图工具如何绘制直方图 使用plotly绘制直方图需要用到graph_objs包中的Histogram函数 我们将数据赋值给函数中的x变量,x = da ...
- Python使用Plotly绘图工具,绘制饼图
今天我们来学习一下如何使用Python的Plotly绘图工具,绘制饼图 使用Plotly绘制饼图的方法,我们需要使用graph_objs中的Pie函数 函数中最常用的两个属性values,用于赋值给需 ...
- Python使用Plotly绘图工具,绘制气泡图
今天来讲讲如何使用Python 绘图工具,Plotly来绘制气泡图. 气泡图的实现方法类似散点图的实现.修改散点图中点的大小,就变成气泡图. 实现代码如下: import plotly as py i ...
- Python使用Plotly绘图工具,绘制甘特图
今天来讲一下如何使用Python 的绘图工具Plotly来绘制甘特图的方法 甘特图大家应该了解熟悉,就是通过条形来显示项目的进度.时间安排等相关情况的. 我们今天来学习一下,如何使用ployly来绘制 ...
- Python使用Plotly绘图工具,绘制水平条形图
水平条形图与绘制柱状图类似,大家可以先看看我之前写的博客,如何绘制柱状图 水平条形图需要在Bar函数中设置orientation= 'h' 其他的参数与柱状图相同.也可以通过设置barmode = ' ...
- Python使用Plotly绘图工具,绘制柱状图
使用Plotly绘制基本的柱状图,需要用到的函数是graph_objs 中 Bar函数 通过参数,可以设置柱状图的样式. 通过barmod进行设置可以绘制出不同类型的柱状图出来. 我们先来实现一个简单 ...
- 使用工厂方法模式设计能够实现包含加法(+)、减法(-)、乘法(*)、除法(/)四种运算的计算机程序,要求输入两个数和运算符,得到运算结果。要求使用相关的工具绘制UML类图并严格按照类图的设计编写程序实
2.使用工厂方法模式设计能够实现包含加法(+).减法(-).乘法(*).除法(/)四种运算的计算机程序,要求输入两个数和运算符,得到运算结果.要求使用相关的工具绘制UML类图并严格按照类图的设计编写程 ...
- 1、使用简单工厂模式设计能够实现包含加法(+)、减法(-)、乘法(*)、除法(/)四种运算的计算机程序,要求输入两个数和运算符,得到运算结果。要求使用相关的工具绘制UML类图并严格按照类图的设计编写程
1.使用简单工厂模式设计能够实现包含加法(+).减法(-).乘法(*).除法(/)四种运算的计算机程序,要求输入两个数和运算符,得到运算结果.要求使用相关的工具绘制UML类图并严格按照类图的设计编写程 ...
随机推荐
- [Swift]LeetCode164. 最大间距 | Maximum Gap
Given an unsorted array, find the maximum difference between the successive elements in its sorted f ...
- [Swift]LeetCode227. 基本计算器 II | Basic Calculator II
Implement a basic calculator to evaluate a simple expression string. The expression string contains ...
- [Swift]LeetCode526. 优美的排列 | Beautiful Arrangement
Suppose you have N integers from 1 to N. We define a beautiful arrangement as an array that is const ...
- [Swift]LeetCode934. 最短的桥 | Shortest Bridge
In a given 2D binary array A, there are two islands. (An island is a 4-directionally connected grou ...
- C# 多线程学习笔记 - 1
本文主要针对 GKarch 相关文章留作笔记,仅在原文基础上记录了自己的理解与摘抄部分片段. 遵循原作者的 CC 3.0 协议. 如果想要了解更加详细的文章信息内容,请访问下列地址进行学习. 原文章地 ...
- Zabbix系列之八——安装agent监控windows
一.下载zabbix-agent客户端 被监控的主机装在windows server 2012 64位操作系统,被监控端需要安装: http://www.zabbix.com/downloads/3. ...
- 厉害—Ansible管理windows集群
最近公司新项目需要安装400+windows server 2012系统的工作站,想着怎么能像linux下运用ansible批量管理,linux就很简单了有ssh服务 但是下却没这么简单,但还是有办法 ...
- 说一说MVC的CSRF(三)
用途:防止CSRF(跨网站请求伪造). 用法:在View->Form表单中:<%:Html.AntiForgeryToken()%> 在Controller->Action动作 ...
- qt 坐标变换
原文链接:Qt学习之路(28): 坐标变换 同很多坐标系统一样,QPainter的默认坐标的原点(0, 0)位于屏幕的左上角,X轴正方向是水平向右,Y轴正方向是竖直向下.在这个坐标系统中,每个像素 ...
- Python进阶:迭代器与迭代器切片
2018-12-31 更新声明:切片系列文章本是分三篇写成,现已合并成一篇.合并后,修正了一些严重的错误(如自定义序列切片的部分),还对行文结构与章节衔接做了大量改动.原系列的单篇就不删除了,毕竟也是 ...