
吴裕雄--天生自然 PYTHON数据分析:钦奈水资源管理分析
df = pd.read_csv("F:\\kaggleDataSet\\chennai-water\\chennai_reservoir_levels.csv")

df["Date"] = pd.to_datetime(df["Date"], format='%d-%m-%Y')

df.head()

import datetime

def scatter_plot(cnt_srs, color):

    trace = go.Scatter(

        x=cnt_srs.index[::-1],

        y=cnt_srs.values[::-1],

        showlegend=False,

        marker=dict(

            color=color,

        ),

    )

    return trace

cnt_srs = df["POONDI"]

cnt_srs.index = df["Date"]

trace1 = scatter_plot(cnt_srs, 'red')

cnt_srs = df["CHOLAVARAM"]

cnt_srs.index = df["Date"]

trace2 = scatter_plot(cnt_srs, 'blue')

cnt_srs = df["REDHILLS"]

cnt_srs.index = df["Date"]

trace3 = scatter_plot(cnt_srs, 'green')

cnt_srs = df["CHEMBARAMBAKKAM"]

cnt_srs.index = df["Date"]

trace4 = scatter_plot(cnt_srs, 'purple')

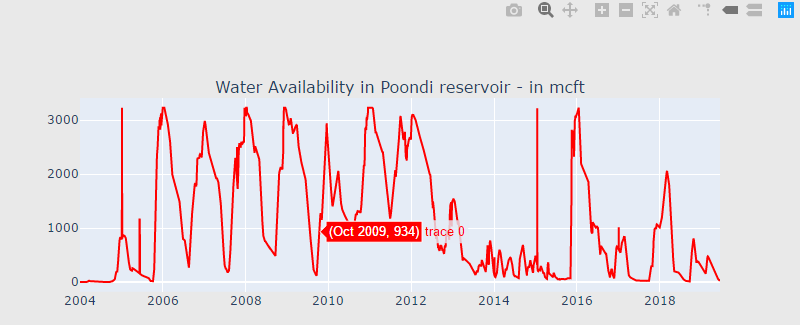
subtitles = ["Water Availability in Poondi reservoir - in mcft",

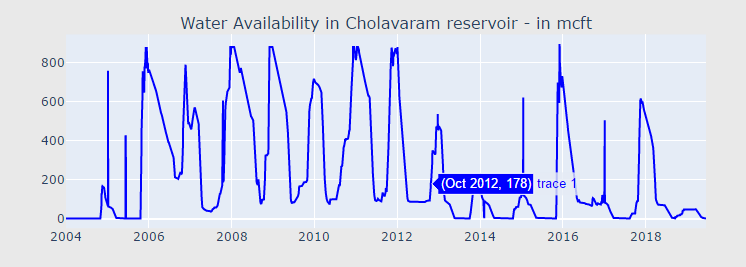
             "Water Availability in Cholavaram reservoir - in mcft",

             "Water Availability in Redhills reservoir - in mcft",

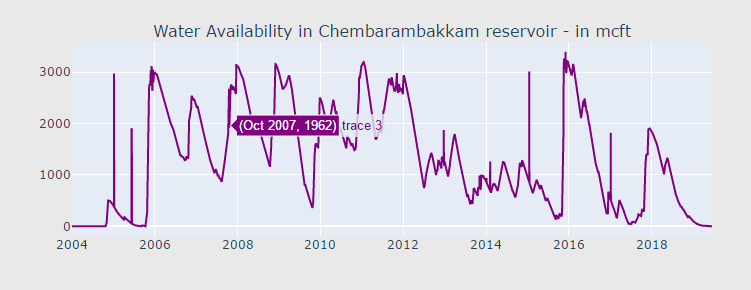
             "Water Availability in Chembarambakkam reservoir - in mcft"

            ]

fig = tools.make_subplots(rows=4, cols=1, vertical_spacing=0.08,

                          subplot_titles=subtitles)

fig.append_trace(trace1, 1, 1)

fig.append_trace(trace2, 2, 1)

fig.append_trace(trace3, 3, 1)

fig.append_trace(trace4, 4, 1)

fig['layout'].update(height=1200, width=800, paper_bgcolor='rgb(233,233,233)')

py.iplot(fig, filename='h2o-plots')

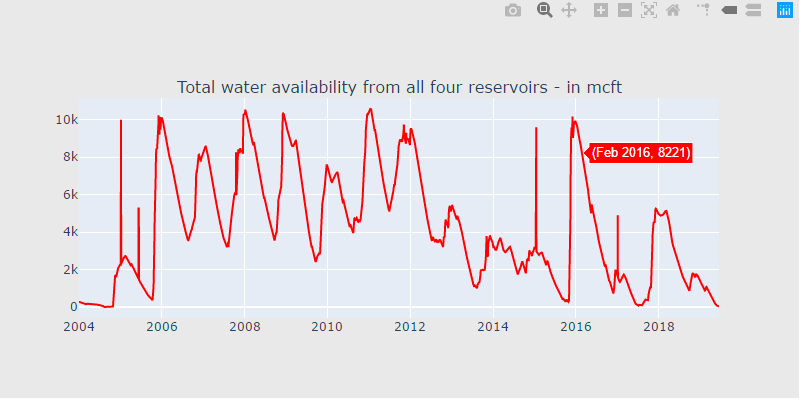
df["total"] = df["POONDI"] + df["CHOLAVARAM"] + df["REDHILLS"] + df["CHEMBARAMBAKKAM"]

df["total"] = df["POONDI"] + df["CHOLAVARAM"] + df["REDHILLS"] + df["CHEMBARAMBAKKAM"]

cnt_srs = df["total"]

cnt_srs.index = df["Date"]

trace5 = scatter_plot(cnt_srs, 'red')

fig = tools.make_subplots(rows=1, cols=1, vertical_spacing=0.08,

                          subplot_titles=["Total water availability from all four reservoirs - in mcft"])

fig.append_trace(trace5, 1, 1)

fig['layout'].update(height=400, width=800, paper_bgcolor='rgb(233,233,233)')

py.iplot(fig, filename='h2o-plots')
rain_df = pd.read_csv("F:\\kaggleDataSet\\chennai-water\\chennai_reservoir_rainfall.csv")

rain_df["Date"] = pd.to_datetime(rain_df["Date"], format='%d-%m-%Y')

rain_df["total"] = rain_df["POONDI"] + rain_df["CHOLAVARAM"] + rain_df["REDHILLS"] + rain_df["CHEMBARAMBAKKAM"]

rain_df["total"] = rain_df["POONDI"] + rain_df["CHOLAVARAM"] + rain_df["REDHILLS"] + rain_df["CHEMBARAMBAKKAM"]

def bar_plot(cnt_srs, color):

    trace = go.Bar(

        x=cnt_srs.index[::-1],

        y=cnt_srs.values[::-1],

        showlegend=False,

        marker=dict(

            color=color,

        ))

    return trace

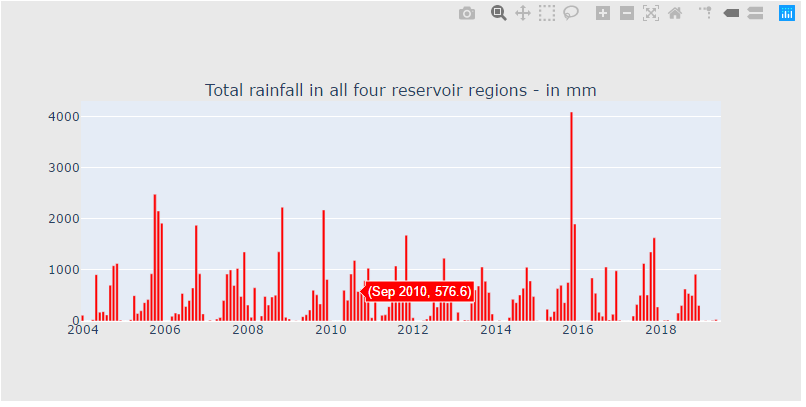
rain_df["YearMonth"] = pd.to_datetime(rain_df["Date"].dt.year.astype(str) + rain_df["Date"].dt.month.astype(str), format='%Y%m')

cnt_srs = rain_df.groupby("YearMonth")["total"].sum()

trace5 = bar_plot(cnt_srs, 'red')

fig = tools.make_subplots(rows=1, cols=1, vertical_spacing=0.08,

                          subplot_titles=["Total rainfall in all four reservoir regions - in mm"])

fig.append_trace(trace5, 1, 1)

fig['layout'].update(height=400, width=800, paper_bgcolor='rgb(233,233,233)')

py.iplot(fig, filename='h2o-plots')
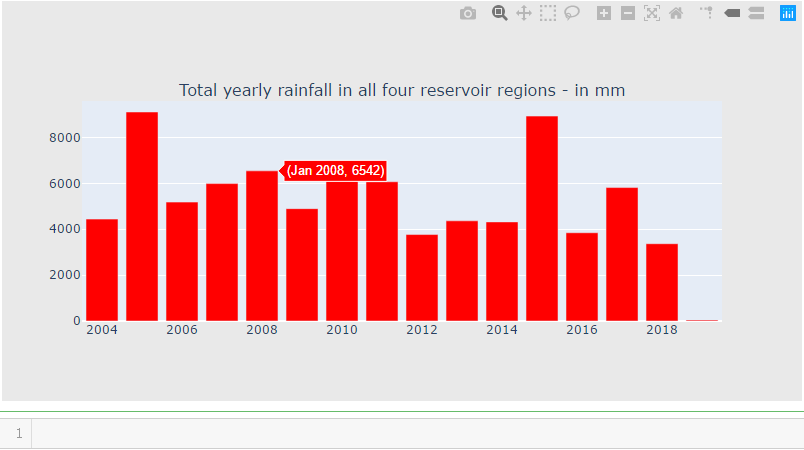
rain_df["Year"] = pd.to_datetime(rain_df["Date"].dt.year.astype(str), format='%Y')

cnt_srs = rain_df.groupby("Year")["total"].sum()

trace5 = bar_plot(cnt_srs, 'red')

fig = tools.make_subplots(rows=1, cols=1, vertical_spacing=0.08,

                          subplot_titles=["Total yearly rainfall in all four reservoir regions - in mm"])

fig.append_trace(trace5, 1, 1)

fig['layout'].update(height=400, width=800, paper_bgcolor='rgb(233,233,233)')

py.iplot(fig, filename='h2o-plots')
temp_df = df[(df["Date"].dt.month==2) & (df["Date"].dt.day==1)]

cnt_srs = temp_df["total"]

cnt_srs.index = temp_df["Date"]

trace5 = bar_plot(cnt_srs, 'red')

fig = tools.make_subplots(rows=1, cols=1, vertical_spacing=0.08,

                          subplot_titles=["Availability of total reservoir water (4 major ones) at the beginning of summer"])

fig.append_trace(trace5, 1, 1)

fig['layout'].update(height=400, width=800, paper_bgcolor='rgb(233,233,233)')

py.iplot(fig, filename='h2o-plots')

结论:

2004年的水资源短缺使维拉南湖成为城市供水的新途径。

希望目前的缺水能为这个陷入困境的城市带来更多额外的水源。在过去的15年里,这个城市发展了很多,因此需要额外的水资源来满足需求。

城市需要通过提前估计需求来设计更好的稀缺控制方法。现在,

“只有下雨才能拯救这座城市!”
吴裕雄--天生自然 PYTHON数据分析:钦奈水资源管理分析的更多相关文章
- 吴裕雄--天生自然 PYTHON数据分析:糖尿病视网膜病变数据分析(完整版)
# This Python 3 environment comes with many helpful analytics libraries installed # It is defined by ...
- 吴裕雄--天生自然 PYTHON数据分析:所有美国股票和etf的历史日价格和成交量分析
# This Python 3 environment comes with many helpful analytics libraries installed # It is defined by ...
- 吴裕雄--天生自然 python数据分析:健康指标聚集分析(健康分析)
# This Python 3 environment comes with many helpful analytics libraries installed # It is defined by ...
- 吴裕雄--天生自然 python数据分析:葡萄酒分析
# import pandas import pandas as pd # creating a DataFrame pd.DataFrame({'Yes': [50, 31], 'No': [101 ...
- 吴裕雄--天生自然 PYTHON数据分析:人类发展报告——HDI, GDI,健康,全球人口数据数据分析
import pandas as pd # Data analysis import numpy as np #Data analysis import seaborn as sns # Data v ...
- 吴裕雄--天生自然 python数据分析:医疗费数据分析
import numpy as np import pandas as pd import os import matplotlib.pyplot as pl import seaborn as sn ...
- 吴裕雄--天生自然 PYTHON数据分析:基于Keras的CNN分析太空深处寻找系外行星数据
#We import libraries for linear algebra, graphs, and evaluation of results import numpy as np import ...
- 吴裕雄--天生自然 python数据分析:基于Keras使用CNN神经网络处理手写数据集
import pandas as pd import numpy as np import matplotlib.pyplot as plt import matplotlib.image as mp ...
- 吴裕雄--天生自然 PYTHON数据分析:医疗数据分析
import numpy as np # linear algebra import pandas as pd # data processing, CSV file I/O (e.g. pd.rea ...
随机推荐
- mysql慢SQL排查之show processlist和show full processlist
mysql排查线上数据库问题,经常会用到 show processlist和show full processlist这两条命令 processlist命令的输出结果显示了有哪些线程在运行,不仅可以查 ...
- flask框架-下
Local与偏函数 threasing.local 多个线程修改同一个数据,复制多份变量给每个线程用,为每个线程开辟一块空间进行数据存储. 不使用therading.local # 不用local f ...
- python导入自定义的库
一.导入项目文件夹下的模块 1.导入整个模块 import 模块名 2.导入模块的某个函数 from 模块名 import 函数名 示例 untitled是项目文件夹,文件结构如下 ①在a.py导入c ...
- C/S 和 B/S架构
C/S 和 B/S架构 一.单机架构 应用领域: 植物大战僵尸 office 二.C/S架构 [ 应用领域: QQ 大型网络游戏 计算机发展初期用户去取数据,直接就去主机拿,从这里开始就分出了客户端和 ...
- JS - ES5与ES6面向对象编程
1.面向对象 1.1 两大编程思想 1.2 面向过程编程 POP(Process-oriented programming) 1.3 面向对象编程 OOP (Object Oriented Progr ...
- 0x10 - PostgreSQL 安装之 CentOS7 + Patroni
PostgreSQL + CentOS7 + Patroni 背景 PostgreSQL 的高可用环境 环境 CentOS 7 pg01 (192.168.1.120) pg02 (192.168.1 ...
- logstash 使用glusterfs网络存储偶发性文件解析异常的问题
其实问题到现在为止也没有解决 因为服务是部署在k8s上,挂载的,偶发性的出现文件解析异常 bom头已经验证过了 手动重新解析这些文件完全正常,问题无法复现,文件本身并没有问题. 最后怀疑到了最不该怀疑 ...
- Chapter1. The Electromagnetic Model (Field and Wave Electromagnetics. Second Edition) David K. Cheng
1-1 Introduction electric charge n.电荷 vice versa adv. 反之亦然 elastic adj. 弹性的 postulate v.假定 hasten v. ...
- Java操作redis客户端Jedis连接集群(Cluster)
创建JedisCluster类连接redis集群. @Test public void testJedisCluster() throws Exception { //创建一连接,JedisClust ...
- Linux基础篇九:用户管理
查看当前用户的ID信息(也可以查看其他用户的ID信息) 每个进程都会有一个用户身份运行 cat /etc/passwd 账号的操作: useradd (新建用户) 例题: groupadd s ...