
《DSP using MATLAB》Problem 2.4
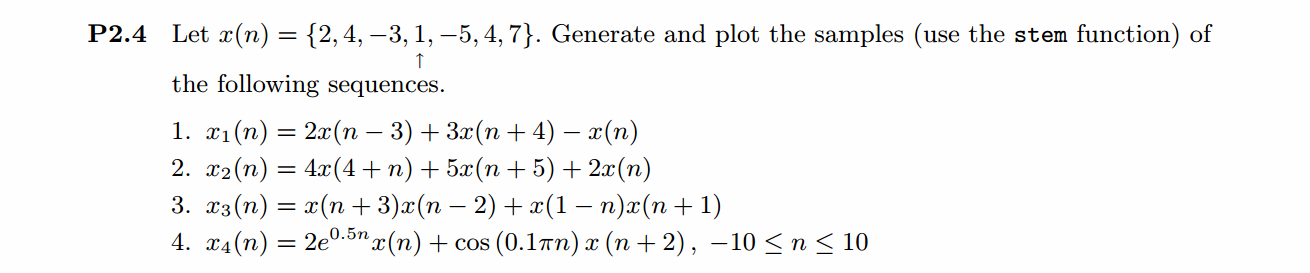
生成并用stem函数画出这几个序列。
1、代码:
%% ------------------------------------------------------------------------

%%            Output Info about this m-file

fprintf('\n***********************************************************\n');

fprintf('        <DSP using MATLAB> Problem 2.4.1 \n\n');

time_stamp = datestr(now, 31);

[wkd1, wkd2] = weekday(today, 'long');

fprintf('      Now is %20s, and it is %7s  \n\n', time_stamp, wkd2);

%% ------------------------------------------------------------------------

%%

%% x(n)={2,4,-3,1,-5,4,7}     -3:3

%%              *

%% x1(n) = 2x(n-3) + 3x(n+4) - x(n)

x = [2,4,-3,1,-5,4,7]

n = [-3:3]

[x11,n11] = sigshift(x,n,3)

[x12,n12] = sigshift(x,n,-4)

[x13,n13] = sigshift(x,n,0);

[x1,n1] = sigadd(2 * x11, n11, 3 * x12, n12);

[x1,n1] = sigadd(x1, n1, -x13, n13)

figure

set(gcf,'Color','white');

stem(n,x); title('x(n)');

xlabel('n'); ylabel('x');grid on;

figure

set(gcf,'Color','white');

stem(n11,x11); title('x11(n)=x(n-3)');

xlabel('n'); ylabel('x11(n)');grid on;

figure

set(gcf,'Color','white');

stem(n12,x12); title('x12 = x(n+4)');

xlabel('n'); ylabel('x11(n)');grid on;

figure

set(gcf,'Color','white');

stem(n1,x1); title('x1 = 2x(n-3) + 3x(n+4) -x(n))');

xlabel('n'); ylabel('x1(n)');grid on;
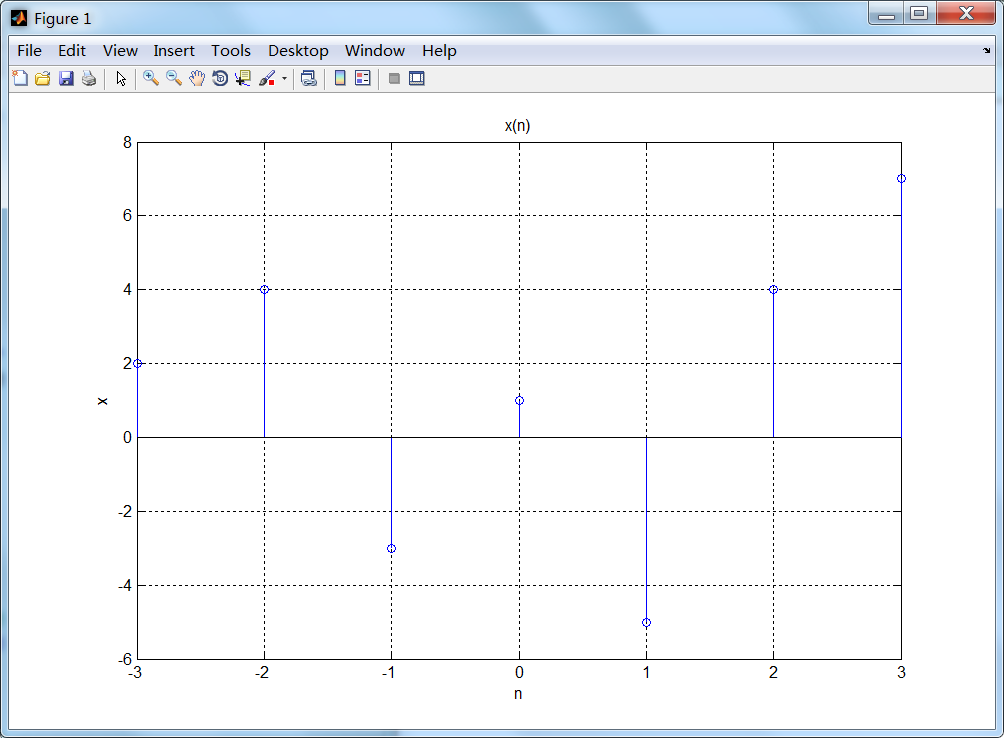
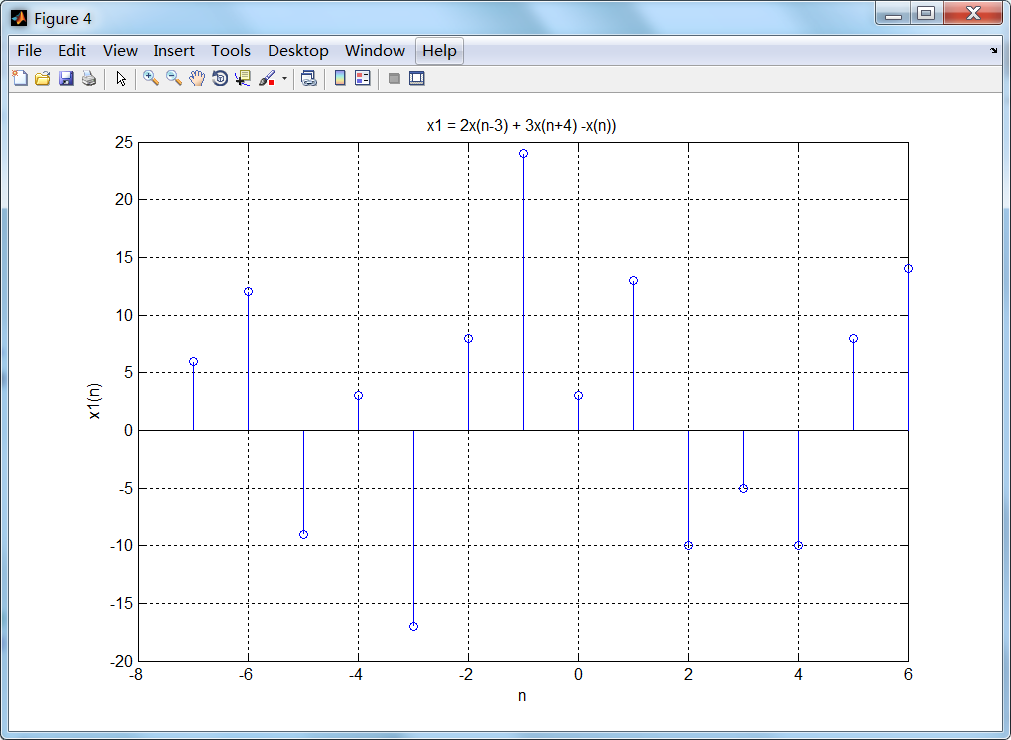
运行结果:


2、代码:
%% ------------------------------------------------------------------------

%%            Output Info about this m-file

fprintf('\n***********************************************************\n');

fprintf('        <DSP using MATLAB> Problem 2.4.2 \n\n');

time_stamp = datestr(now, 31);

[wkd1, wkd2] = weekday(today, 'long');

fprintf('      Now is %20s, and it is %7s  \n\n', time_stamp, wkd2);

%% ------------------------------------------------------------------------

%%

%% x(n)={2,4,-3,1,-5,4,7}     -3:3

%%              *

%% x2(n) = 4x(4+n) + 5x(n+5) + 2x(n)

x = [2,4,-3,1,-5,4,7]

n = [-3:3]

[x11,n11] = sigshift(x,n,-4)

[x12,n12] = sigshift(x,n,-5)

[x13,n13] = sigshift(x,n,0);

[x1,n1] = sigadd(4*x11, n11, 5*x12,n12);

[x1,n1] = sigadd(x1,n1,2*x13,n13)

figure

set(gcf,'Color','white');

stem(n,x); title('x(n)');

xlabel('n'); ylabel('x');grid on;

figure

set(gcf,'Color','white');

stem(n11,x11); title('x11(n)=x(4+n)');

xlabel('n'); ylabel('x11(n)');grid on;

figure

set(gcf,'Color','white');

stem(n12,x12); title('x12 = x(n+5)');

xlabel('n'); ylabel('x11(n)');grid on;

figure

set(gcf,'Color','white');

stem(n1,x1); title('x1 = 4x(4+n) + 5x(n+5) +2x(n))');

xlabel('n'); ylabel('x1(n)');grid on;
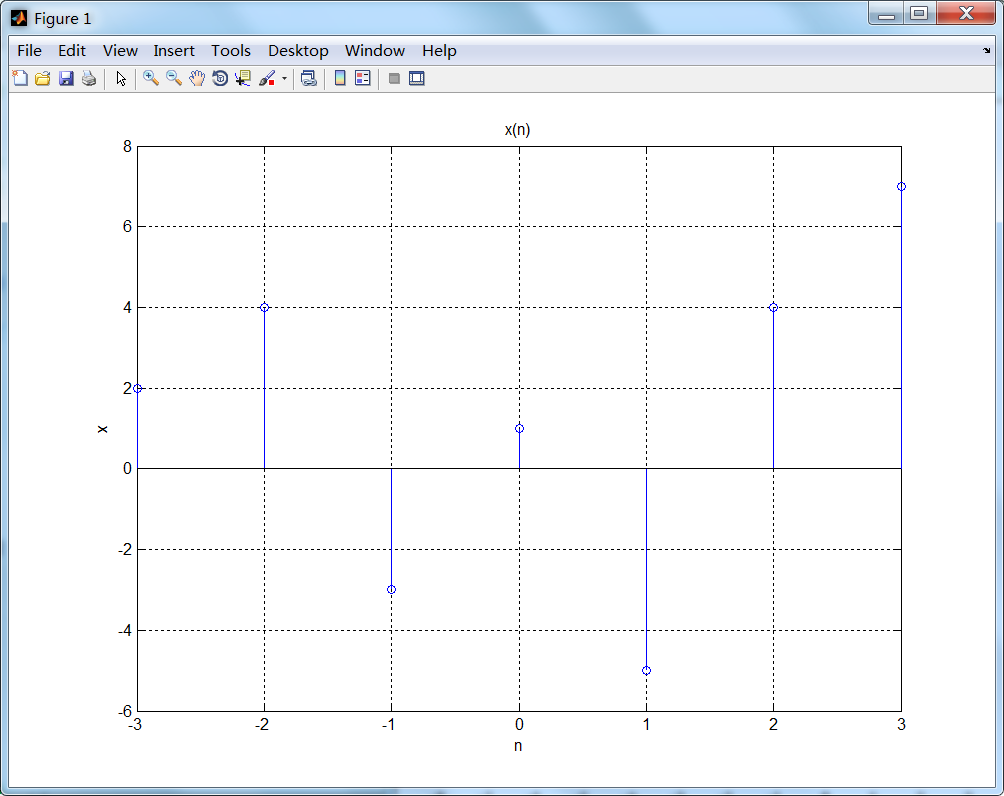
运行结果:
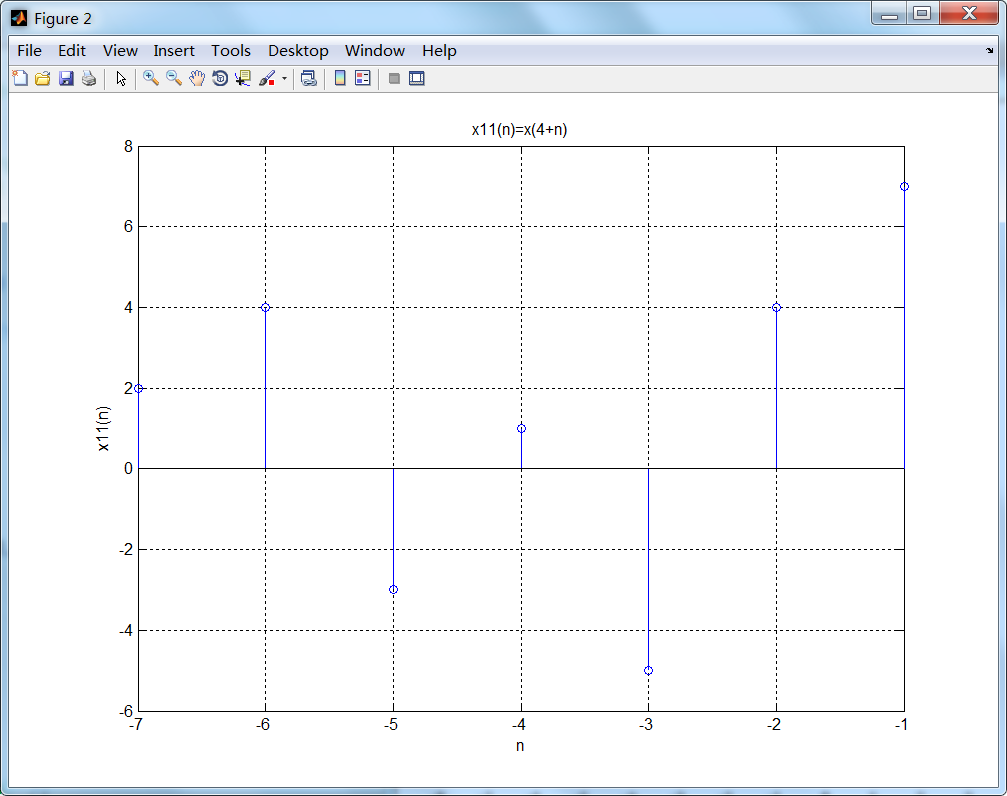

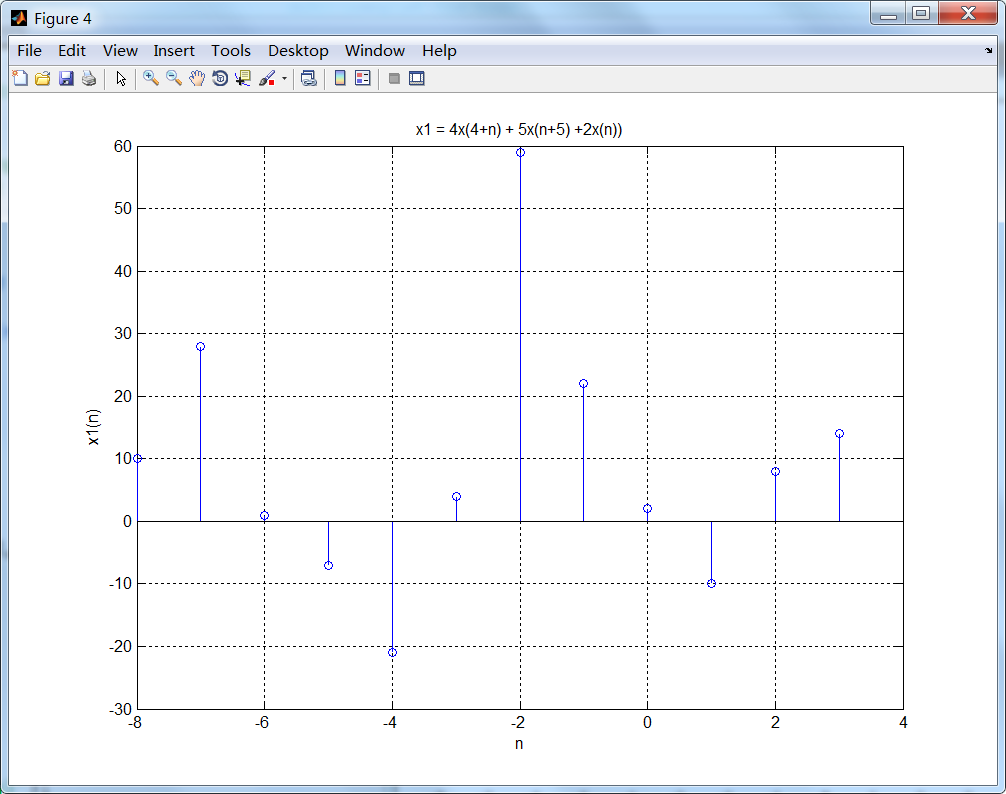
3、代码:
%% ------------------------------------------------------------------------

%%            Output Info about this m-file

fprintf('\n***********************************************************\n');

fprintf('        <DSP using MATLAB> Problem 2.4.3 \n\n');

time_stamp = datestr(now, 31);

[wkd1, wkd2] = weekday(today, 'long');

fprintf('      Now is %20s, and it is %7s  \n\n', time_stamp, wkd2);

%% ------------------------------------------------------------------------

%%

%% x(n)={2,4,-3,1,-5,4,7}     -3:3

%%              *

%% x3(n) = x(n+3)x(n-2) + x(1-n)x(n+1)

n = [-3:3];

x = [2,4,-3,1,-5,4,7];

[x11,n11] = sigshift(x,n,-3); [x12,n12] = sigshift(x,n,2);

[x13,n13] = sigfold(x,n); [x13,n13] = sigshift(x13,n13,1);

[x14,n14] = sigshift(x,n,-1);

[x21,n21] = sigmult(x11, n11, x12,n12);

[x22,n22] = sigmult(x13, n13, x14,n14);

[x3,n3] = sigadd(x21,n21,x22,n22);

figure

set(gcf,'Color','white');

subplot(3,1,1); stem(n,x);    title('x(n)');  xlabel('n'); ylabel('x');grid on;

subplot(3,1,2); stem(n11,x11);title('x(n+3)');xlabel('n'); ylabel('x');grid on;

subplot(3,1,3); stem(n12,x12);title('x(n-2)');xlabel('n'); ylabel('x');grid on;

figure

set(gcf,'Color','white');

subplot(3,1,1); stem(n,x);    title('x(n)'); xlabel('n'); ylabel('x');grid on;

subplot(3,1,2); stem(n13,x13);title('x(1-n)');xlabel('n'); ylabel('x');grid on;

subplot(3,1,3); stem(n14,x14);title('x(n+1)');xlabel('n'); ylabel('x');grid on;

figure

set(gcf,'Color','white');

subplot(2,1,1); stem(n21,x21);title('x(n+3)x(n-2)');xlabel('n'); ylabel('x');grid on;

subplot(2,1,2); stem(n12,x12); title('x12 = x(n+5)');title('x(n+3)');xlabel('n'); ylabel('x');grid on;

xlabel('n'); ylabel('x11(n)');grid on;

figure

set(gcf,'Color','white');

stem(n3,x3); title('x1 = 4x(4+n) + 5x(n+5) +2x(n))');

xlabel('n'); ylabel('x1(n)');grid on;
运行结果:
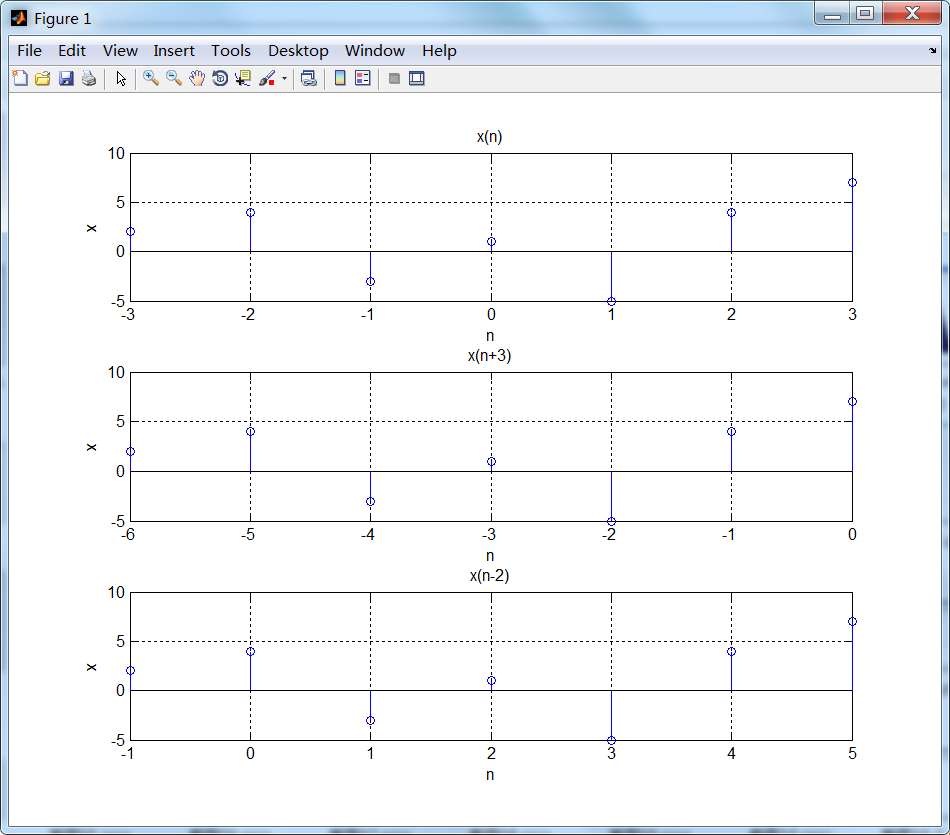


4、代码:
%% ------------------------------------------------------------------------

%%            Output Info about this m-file

fprintf('\n***********************************************************\n');

fprintf('        <DSP using MATLAB> Problem 2.4.4 \n\n');

time_stamp = datestr(now, 31);

[wkd1, wkd2] = weekday(today, 'long');

fprintf('      Now is %20s, and it is %7s  \n\n', time_stamp, wkd2);

%% ------------------------------------------------------------------------

%%

%% x(n)={2,4,-3,1,-5,4,7}     -3:3

%%              *

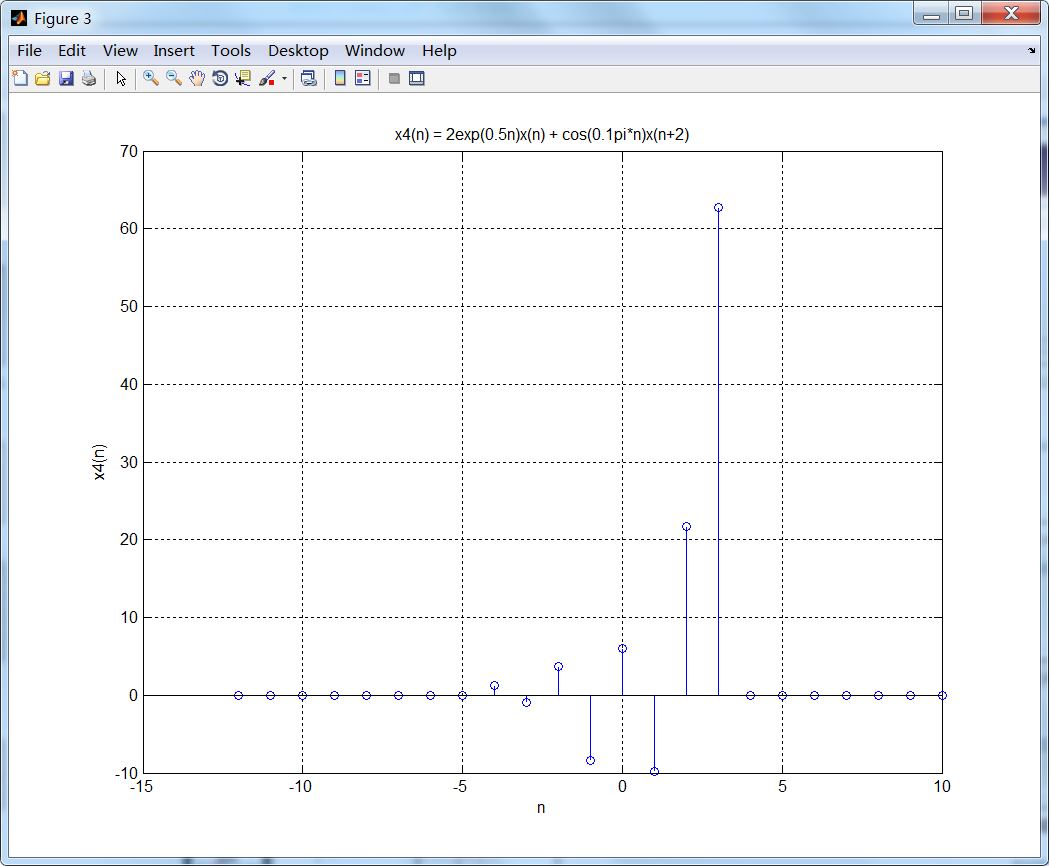
%% x4(n) = 2exp(0.5n)x(n) + cos(0.1pi*n)x(n+2)

n = [-10:10];

x = [zeros(1, 7), 2, 4, -3, 1, -5, 4, 7, zeros(1,7)];

x11 = exp(0.5*n);

x12 = cos(0.1*pi*n);

[x13,n13] = sigshift(x,n,-2);

[x21,n21] = sigmult(2*x11, n, x, n);

[x22,n22] = sigmult(x12, n, x13, n13);

[x4,n4] = sigadd(x21, n21, x22, n22);

%x4 = 2*exp(0.5*n)*x(n) + cos(0.1*pi*n)*x11(n11);

figure

set(gcf,'Color','white');

subplot(3,1,1); stem(n, x);  title('x(n)');       xlabel('n'); ylabel('x');grid on;

subplot(3,1,2); stem(n, x11);title('exp(0.5n)');  xlabel('n'); ylabel('x');grid on;

subplot(3,1,3); stem(n, x12);title('cos(0.1\pin)');xlabel('n'); ylabel('x');grid on;

figure

set(gcf,'Color','white');

subplot(3,1,1); stem(n,x);     title('x(n)');               xlabel('n'); ylabel('x');grid on;

subplot(3,1,2); stem(n21, x21);title('2exp(0.5n)*x(n)');    xlabel('n'); ylabel('x');grid on;

subplot(3,1,3); stem(n22, x22);title('cos(0.1\pin)*x(n+2)');xlabel('n'); ylabel('x');grid on;

figure

set(gcf,'Color','white');

stem(n4,x4); title('x4(n) = 2exp(0.5n)x(n) + cos(0.1pi*n)x(n+2)');

xlabel('n'); ylabel('x4(n)');grid on;
运行结果:
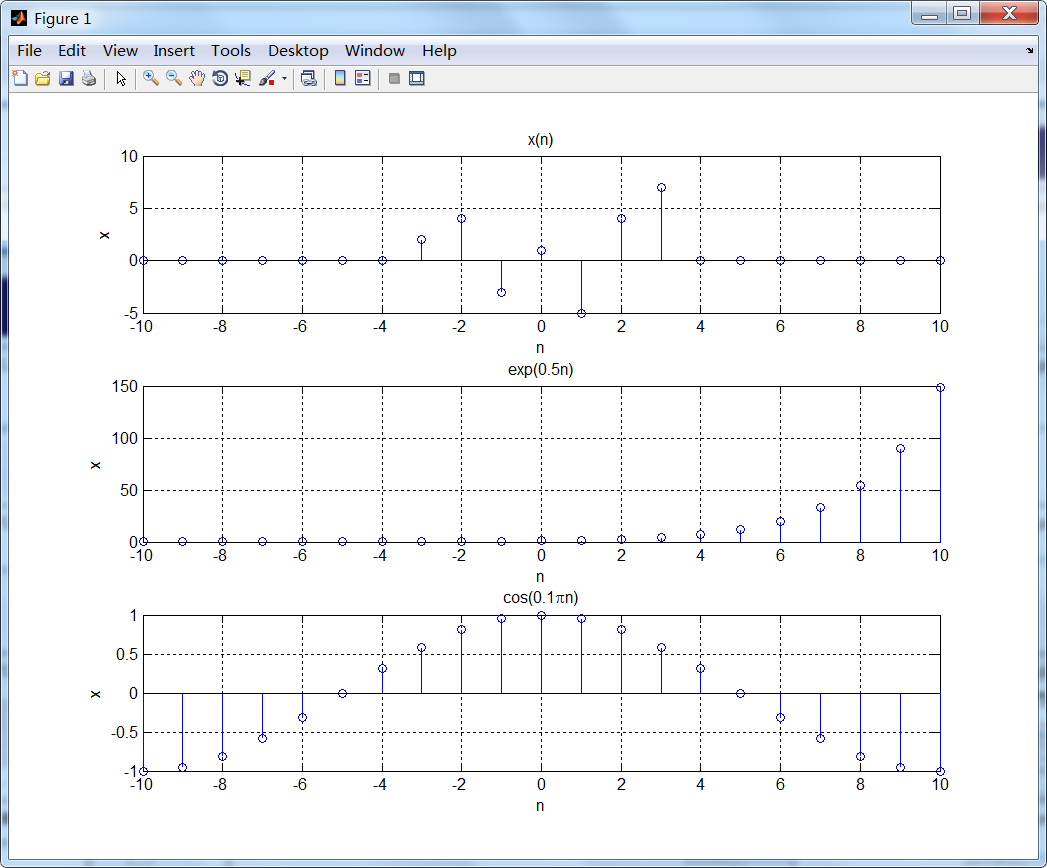

《DSP using MATLAB》Problem 2.4的更多相关文章
- 《DSP using MATLAB》Problem 7.27
代码: %% ++++++++++++++++++++++++++++++++++++++++++++++++++++++++++++++++++++++++++++++++ %% Output In ...
- 《DSP using MATLAB》Problem 7.26
注意:高通的线性相位FIR滤波器,不能是第2类,所以其长度必须为奇数.这里取M=31,过渡带里采样值抄书上的. 代码: %% +++++++++++++++++++++++++++++++++++++ ...
- 《DSP using MATLAB》Problem 7.25
代码: %% ++++++++++++++++++++++++++++++++++++++++++++++++++++++++++++++++++++++++++++++++ %% Output In ...
- 《DSP using MATLAB》Problem 7.24
又到清明时节,…… 注意:带阻滤波器不能用第2类线性相位滤波器实现,我们采用第1类,长度为基数,选M=61 代码: %% +++++++++++++++++++++++++++++++++++++++ ...
- 《DSP using MATLAB》Problem 7.23
%% ++++++++++++++++++++++++++++++++++++++++++++++++++++++++++++++++++++++++++++++++ %% Output Info a ...
- 《DSP using MATLAB》Problem 7.16
使用一种固定窗函数法设计带通滤波器. 代码: %% ++++++++++++++++++++++++++++++++++++++++++++++++++++++++++++++++++++++++++ ...
- 《DSP using MATLAB》Problem 7.15
用Kaiser窗方法设计一个台阶状滤波器. 代码: %% +++++++++++++++++++++++++++++++++++++++++++++++++++++++++++++++++++++++ ...
- 《DSP using MATLAB》Problem 7.14
代码: %% ++++++++++++++++++++++++++++++++++++++++++++++++++++++++++++++++++++++++++++++++ %% Output In ...
- 《DSP using MATLAB》Problem 7.13
代码: %% ++++++++++++++++++++++++++++++++++++++++++++++++++++++++++++++++++++++++++++++++ %% Output In ...
- 《DSP using MATLAB》Problem 7.12
阻带衰减50dB,我们选Hamming窗 代码: %% ++++++++++++++++++++++++++++++++++++++++++++++++++++++++++++++++++++++++ ...
随机推荐
- Linux系统——Ansible批量管理工具
批量管理工具: (1)ansible 操作简单(适用于500台以下服务器) (2)saltstack 比较复杂(一般适用于1000-4w台服务器) (3)puppet超级复杂 systemctl(统一 ...
- SpringBoot 通过自定义注解实现AOP切面编程实例
一直心心念的想写一篇关于AOP切面实例的博文,拖更了许久之后,今天终于着手下笔将其完成. 基础概念 1.切面(Aspect) 首先要理解‘切’字,需要把对象想象成一个立方体,传统的面向对象变成思维,类 ...
- HDU——2955 Robberies (0-1背包)
题意:有N个银行,每抢一个银行,可以获得\(v_i\)的前,但是会有\(p_i\)的概率被抓.现在要把被抓概率控制在\(P\)之下,求最多能抢到多少钱. 分析:0-1背包的变形,把重量变成了概率,因为 ...
- oracle中 start with .. connect by prior.. 用法简介
我们经常会将一个比较复杂的目录树存储到一个表中.或者将一些部门存储到一个表中,而这些部门互相有隶属关系.这个时候你就会用到connect by prior start with.oracle 提供了s ...
- foo、bar美国版的张三李四
不管看javascript还是其他语言举例,经常看到使用foo和bar来充当变量.那么究竟foo.bar是什么鬼? 一说:foo 和 bar 组合在一起所构成的 foobar 应该最能反映其原始的意思 ...
- linux内核分析第三周-跟踪分析Linux内核的启动过程
一.实验流程 1.打开环境 执行命令:cd LinuxKernel/ 执行命令:qemu -kernel linux-3.18.6/arch/x86/boot/bzImage -initrd root ...
- OpenCV/OpenCL/OpenGL区别
OpenCV/OpenCL/OpenGL区别: OpenGL(全写Open Graphics Library)是个定义了一个跨编程语言.跨平台的应用程序接口(API)的规格,它用于生成二维.三维图像. ...
- HDU 2485 Destroying the bus stations(费用流)
http://acm.hdu.edu.cn/showproblem.php?pid=2485 题意: 现在要从起点1到终点n,途中有多个车站,每经过一个车站为1时间,现在要在k时间内到达终点,问至少要 ...
- Gym - 100712D Alternating Strings
http://codeforces.com/gym/100712/attachments 题意: 给出一个01串,现在要切割这个01串,使得每个子串长度都不大于k,并且每个子串不能01交替出现,单个字 ...
- HTML 入门1
HTML 入门1 一,什么是HTML 超文本标记语言 二,如何写一个HTML文件? 1 通过sublime的文件->新建->保存 "文件名.html"格式 2,在 ...