《DSP using MATLAB》Problem 2.2

1、代码:
%% ------------------------------------------------------------------------

%%            Output Info about this m-file

fprintf('\n***********************************************************\n');

fprintf('        <DSP using MATLAB> Problem 2.2.1 \n\n');

time_stamp = datestr(now, 31);

[wkd1, wkd2] = weekday(today, 'long');

fprintf('      Now is %20s, and it is %7s  \n\n', time_stamp, wkd2);

%% ------------------------------------------------------------------------

num = 100000;

x1 = 0 + (2-0)*rand(num,1);

x_axis = min(x1):0.02:max(x1);

figure('NumberTitle', 'off', 'Name', 'Problem 2.2.1 hist');

set(gcf,'Color','white');

%hist(x1,x_axis);

hist(x1,100);

title('Uniformly Distributed Random Numbers (using hist)');

xlabel('n'); ylabel('x1(n)'); grid on;

figure('NumberTitle', 'off', 'Name', 'Problem 2.2.1 bar');

set(gcf,'Color','white');

%[counts,binlocal] = hist(x1, x_axis);

[counts,binlocal] = hist(x1, 100);

counts = counts/num;

bar(binlocal, counts, 1); title('Uniformly Distributed Random Numbers (using bar)');

xlabel('n'); ylabel('x1(n)'); grid on;
运行结果:


2、代码:
%% ------------------------------------------------------------------------
%% Output Info about this m-file
fprintf('\n***********************************************************\n');
fprintf(' <DSP using MATLAB> Problem 2.2.2 \n\n'); time_stamp = datestr(now, 31);
[wkd1, wkd2] = weekday(today, 'long');
fprintf(' Now is %20s, and it is %7s \n\n', time_stamp, wkd2);
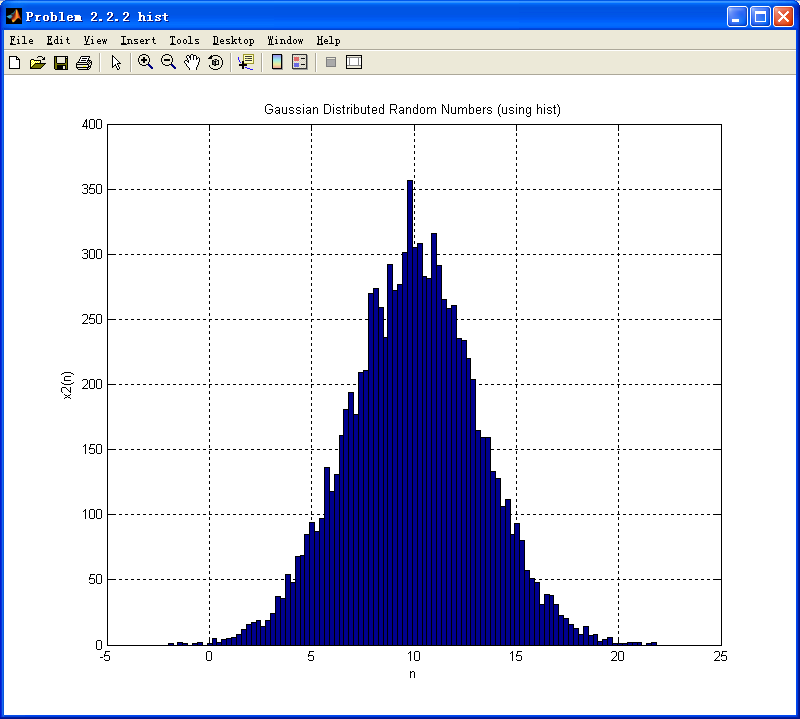
%% ------------------------------------------------------------------------ num = 10000; mean_val=10; variance=10;
x2 = mean_val + sqrt(variance)*randn(num,1);
x_axis = min(x2):0.02:max(x2); figure('NumberTitle', 'off', 'Name', 'Problem 2.2.2 hist');
set(gcf,'Color','white');
%hist(x1,x_axis);
hist(x2,100);
title('Gaussian Distributed Random Numbers (using hist)');
xlabel('n'); ylabel('x2(n)'); grid on; figure('NumberTitle', 'off', 'Name', 'Problem 2.2.2 bar');
set(gcf,'Color','white');
%[counts,binlocal] = hist(x1, x_axis);
[counts,binlocal] = hist(x2, 100);
counts = counts/num;
bar(binlocal, counts, 1); title('Gaussian Distributed Random Numbers (using bar)');
xlabel('n'); ylabel('x2(n)'); grid on;
运行结果:

3、代码:
%% ------------------------------------------------------------------------

%%            Output Info about this m-file

fprintf('\n***********************************************************\n');

fprintf('        <DSP using MATLAB> Problem 2.2.3 \n\n');

time_stamp = datestr(now, 31);

[wkd1, wkd2] = weekday(today, 'long');

fprintf('      Now is %20s, and it is %7s  \n\n', time_stamp, wkd2);

%% ------------------------------------------------------------------------

num = 100000;  n_x1 = 0:num-1;

x1 = 0 + (2-0)*rand(num,1);

%x_axis = min(x2):0.02:max(x2);

[x11,n_x11] = sigshift(x1,n_x1,1)

[x3,n_x3] = sigadd (x1, n_x1, x11, n_x11)

%% -------------------------------- START --------------------------------------------

%  x1(n)'s hist and bar function

figure('NumberTitle', 'off', 'Name', 'Problem 2.2.3');

set(gcf,'Color','white');

hist(x1,100);

title('Uniformly Distributed Random Numbers (using hist)');

xlabel('n'); ylabel('x1(n)'); grid on;

figure('NumberTitle', 'off', 'Name', 'Problem 2.2.3');

set(gcf,'Color','white');

[counts,binlocal] = hist(x1, 100);

counts = counts/num;

bar(binlocal, counts, 1); title('Uniformly Distributed Random Numbers (using bar)');

xlabel('n'); ylabel('x1(n)'); grid on;

%% ---------------------------------- END ------------------------------------------------

%% -------------------------------- START --------------------------------------------

%   x3(n) = x1(n) + x1(n-1)   hist and bar function

figure('NumberTitle', 'off', 'Name', 'Problem 2.2.3');

set(gcf,'Color','white');

hist(x3,100);

title('Uniformly Distributed Random Numbers (using hist)');

xlabel('n'); ylabel('x3(n)'); grid on;

figure('NumberTitle', 'off', 'Name', 'Problem 2.2.3');

set(gcf,'Color','white');

[counts,binlocal] = hist(x3, 100);

counts = counts/num;

bar(binlocal, counts, 1); title('Uniformly Distributed Random Numbers (using bar)');

xlabel('n'); ylabel('x3(n)'); grid on;

%% ---------------------------------- END ------------------------------------------------
运行结果:


两个均匀分布的序列相加,结果呈现三角形分布了。
4、代码:
%% ------------------------------------------------------------------------

%%            Output Info about this m-file

fprintf('\n***********************************************************\n');

fprintf('        <DSP using MATLAB> Problem 2.2.4 \n\n');

time_stamp = datestr(now, 31);

[wkd1, wkd2] = weekday(today, 'long');

fprintf('      Now is %20s, and it is %7s  \n\n', time_stamp, wkd2);

%% ------------------------------------------------------------------------

num = 100000;  n_y = 0:num-1;

y1 = -0.5 + (0.5+0.5)*rand(num,1);

y2 = -0.5 + (0.5+0.5)*rand(num,1);

y3 = -0.5 + (0.5+0.5)*rand(num,1);

y4 = -0.5 + (0.5+0.5)*rand(num,1);

%x_axis = min(x2):0.02:max(x2);

[x41,n_y11] = sigadd (y1, n_y, y2, n_y);

[x42,n_y12] = sigadd (y3, n_y, y4, n_y);

[x4,n_x4] = sigadd (x41, n_y11, x42, n_y12);

%% -------------------------------- START --------------------------------------------

%  x1(n)'s hist and bar function

figure('NumberTitle', 'off', 'Name', 'Problem 2.2.4');

set(gcf,'Color','white');

hist(y1,100);

title('Uniformly Distributed Random Numbers (using hist)');

xlabel('n'); ylabel('y1(n)'); grid on;

figure('NumberTitle', 'off', 'Name', 'Problem 2.2.4');

set(gcf,'Color','white');

[counts,binlocal] = hist(y1, 100);

counts = counts/num;

bar(binlocal, counts, 1); title('Uniformly Distributed Random Numbers (using bar)');

xlabel('n'); ylabel('y1(n)'); grid on;

%% ---------------------------------- END ------------------------------------------------

%% -------------------------------- START --------------------------------------------

%   x3(n) = x1(n) + x1(n-1)   hist and bar function

figure('NumberTitle', 'off', 'Name', 'Problem 2.2.4');

set(gcf,'Color','white');

hist(x4,100);

title('Uniformly Distributed Random Numbers (using hist)');

xlabel('n'); ylabel('x4(n)'); grid on;

figure('NumberTitle', 'off', 'Name', 'Problem 2.2.4');

set(gcf,'Color','white');

[counts,binlocal] = hist(x4, 100);

counts = counts/num;

bar(binlocal, counts, 1); title('Uniformly Distributed Random Numbers (using bar)');

xlabel('n'); ylabel('x4(n)'); grid on;

%% ---------------------------------- END ------------------------------------------------
运行结果:


4个均匀分布的随机序列相加,呈现正态分布的特征了。
《DSP using MATLAB》Problem 2.2的更多相关文章
- 《DSP using MATLAB》Problem 7.27
代码: %% ++++++++++++++++++++++++++++++++++++++++++++++++++++++++++++++++++++++++++++++++ %% Output In ...
- 《DSP using MATLAB》Problem 7.26
注意:高通的线性相位FIR滤波器,不能是第2类,所以其长度必须为奇数.这里取M=31,过渡带里采样值抄书上的. 代码: %% +++++++++++++++++++++++++++++++++++++ ...
- 《DSP using MATLAB》Problem 7.25
代码: %% ++++++++++++++++++++++++++++++++++++++++++++++++++++++++++++++++++++++++++++++++ %% Output In ...
- 《DSP using MATLAB》Problem 7.24
又到清明时节,…… 注意:带阻滤波器不能用第2类线性相位滤波器实现,我们采用第1类,长度为基数,选M=61 代码: %% +++++++++++++++++++++++++++++++++++++++ ...
- 《DSP using MATLAB》Problem 7.23
%% ++++++++++++++++++++++++++++++++++++++++++++++++++++++++++++++++++++++++++++++++ %% Output Info a ...
- 《DSP using MATLAB》Problem 7.16
使用一种固定窗函数法设计带通滤波器. 代码: %% ++++++++++++++++++++++++++++++++++++++++++++++++++++++++++++++++++++++++++ ...
- 《DSP using MATLAB》Problem 7.15
用Kaiser窗方法设计一个台阶状滤波器. 代码: %% +++++++++++++++++++++++++++++++++++++++++++++++++++++++++++++++++++++++ ...
- 《DSP using MATLAB》Problem 7.14
代码: %% ++++++++++++++++++++++++++++++++++++++++++++++++++++++++++++++++++++++++++++++++ %% Output In ...
- 《DSP using MATLAB》Problem 7.13
代码: %% ++++++++++++++++++++++++++++++++++++++++++++++++++++++++++++++++++++++++++++++++ %% Output In ...
- 《DSP using MATLAB》Problem 7.12
阻带衰减50dB,我们选Hamming窗 代码: %% ++++++++++++++++++++++++++++++++++++++++++++++++++++++++++++++++++++++++ ...
随机推荐
- NiFi REST API 的使用
一.概述 为方便用户使用 NiFi 进行二次开发,NiFi 为开发者提供了 NIFI REST API. 关于 API 的详细介绍,请参见官网 NIFI REST API.这里仅给出一些注意的小细节. ...
- 【转载】JS Number类型数字位数及IEEE754标准
JS的基础类型Number,遵循 IEEE 754 规范,采用双精度存储(double precision),占用 64 bit.如图 意义 1位用来表示符号位 11位用来表示指数 52位表示尾数 浮 ...
- pyDay17
1.用filter求素数. 埃拉托色尼筛选法. #!/usr/bin/env python3 # -*- coding: utf-8 -*- def _odd_iter(): n = 1 while ...
- Tomcat启动报错:StandardServer.await: create[8005] java.net.BindException: Cannot assign requested address
Tomcat启动报错:StandardServer.await: create[8005] java.net.BindException: Cannot assign requested addres ...
- Google发布机器学习平台Tensorflow游乐场~带你玩神经网络(转载)
Google发布机器学习平台Tensorflow游乐场-带你玩神经网络 原文地址:http://f.dataguru.cn/article-9324-1.html> 摘要: 昨天,Google发 ...
- 如何在编辑框中使用IAutoComplete接口(转载)
出自:http://www.vckbase.com/index.php/wv/27.html 如果可能我想用打包类来实现.唉!,就叫我封装先生吧. 你算是找对地方了.但是我要先声明我的解决办法不是你所 ...
- BZOJ 3064 CPU监控
题目链接:CPU监控 学习一番线段树的历史标记- 这道题就是区间加法,区间赋值,要询问区间最大值 和 区间历史最大值的最大值. 然后这种题就是在现有标记的基础上多弄一套标记,维护这个点出现过的最大的标 ...
- Android:你好,androidX!再见,android.support
1.AndroidX简介 点击查看Android文档中对androidx的简介 按照官方文档说明 androidx 是对 android.support.xxx 包的整理后产物.由于之前的suppor ...
- Java回顾之网络通信
在这篇文章里,我们主要讨论如何使用Java实现网络通信,包括TCP通信.UDP通信.多播以及NIO. TCP连接 TCP的基础是Socket,在TCP连接中,我们会使用ServerSocket和Soc ...
- vue双向数据绑定最最最最最简单直观的例子
vue双向数据绑定最最最最最简单直观的例子 一.总结 一句话总结:双向绑定既不仅model可以影响view的数据,view也可以影响model的数据 view model 数据 1.vue双向数据绑定 ...