《DSP using MATLAB》Problem 2.2

1、代码:
%% ------------------------------------------------------------------------

%%            Output Info about this m-file

fprintf('\n***********************************************************\n');

fprintf('        <DSP using MATLAB> Problem 2.2.1 \n\n');

time_stamp = datestr(now, 31);

[wkd1, wkd2] = weekday(today, 'long');

fprintf('      Now is %20s, and it is %7s  \n\n', time_stamp, wkd2);

%% ------------------------------------------------------------------------

num = 100000;

x1 = 0 + (2-0)*rand(num,1);

x_axis = min(x1):0.02:max(x1);

figure('NumberTitle', 'off', 'Name', 'Problem 2.2.1 hist');

set(gcf,'Color','white');

%hist(x1,x_axis);

hist(x1,100);

title('Uniformly Distributed Random Numbers (using hist)');

xlabel('n'); ylabel('x1(n)'); grid on;

figure('NumberTitle', 'off', 'Name', 'Problem 2.2.1 bar');

set(gcf,'Color','white');

%[counts,binlocal] = hist(x1, x_axis);

[counts,binlocal] = hist(x1, 100);

counts = counts/num;

bar(binlocal, counts, 1); title('Uniformly Distributed Random Numbers (using bar)');

xlabel('n'); ylabel('x1(n)'); grid on;
运行结果:


2、代码:
%% ------------------------------------------------------------------------
%% Output Info about this m-file
fprintf('\n***********************************************************\n');
fprintf(' <DSP using MATLAB> Problem 2.2.2 \n\n'); time_stamp = datestr(now, 31);
[wkd1, wkd2] = weekday(today, 'long');
fprintf(' Now is %20s, and it is %7s \n\n', time_stamp, wkd2);
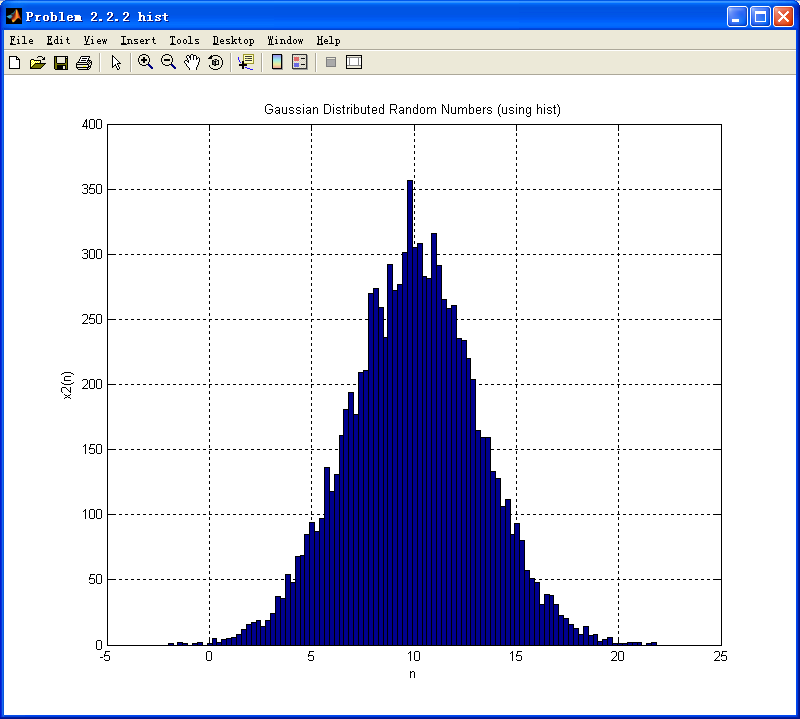
%% ------------------------------------------------------------------------ num = 10000; mean_val=10; variance=10;
x2 = mean_val + sqrt(variance)*randn(num,1);
x_axis = min(x2):0.02:max(x2); figure('NumberTitle', 'off', 'Name', 'Problem 2.2.2 hist');
set(gcf,'Color','white');
%hist(x1,x_axis);
hist(x2,100);
title('Gaussian Distributed Random Numbers (using hist)');
xlabel('n'); ylabel('x2(n)'); grid on; figure('NumberTitle', 'off', 'Name', 'Problem 2.2.2 bar');
set(gcf,'Color','white');
%[counts,binlocal] = hist(x1, x_axis);
[counts,binlocal] = hist(x2, 100);
counts = counts/num;
bar(binlocal, counts, 1); title('Gaussian Distributed Random Numbers (using bar)');
xlabel('n'); ylabel('x2(n)'); grid on;
运行结果:

3、代码:
%% ------------------------------------------------------------------------

%%            Output Info about this m-file

fprintf('\n***********************************************************\n');

fprintf('        <DSP using MATLAB> Problem 2.2.3 \n\n');

time_stamp = datestr(now, 31);

[wkd1, wkd2] = weekday(today, 'long');

fprintf('      Now is %20s, and it is %7s  \n\n', time_stamp, wkd2);

%% ------------------------------------------------------------------------

num = 100000;  n_x1 = 0:num-1;

x1 = 0 + (2-0)*rand(num,1);

%x_axis = min(x2):0.02:max(x2);

[x11,n_x11] = sigshift(x1,n_x1,1)

[x3,n_x3] = sigadd (x1, n_x1, x11, n_x11)

%% -------------------------------- START --------------------------------------------

%  x1(n)'s hist and bar function

figure('NumberTitle', 'off', 'Name', 'Problem 2.2.3');

set(gcf,'Color','white');

hist(x1,100);

title('Uniformly Distributed Random Numbers (using hist)');

xlabel('n'); ylabel('x1(n)'); grid on;

figure('NumberTitle', 'off', 'Name', 'Problem 2.2.3');

set(gcf,'Color','white');

[counts,binlocal] = hist(x1, 100);

counts = counts/num;

bar(binlocal, counts, 1); title('Uniformly Distributed Random Numbers (using bar)');

xlabel('n'); ylabel('x1(n)'); grid on;

%% ---------------------------------- END ------------------------------------------------

%% -------------------------------- START --------------------------------------------

%   x3(n) = x1(n) + x1(n-1)   hist and bar function

figure('NumberTitle', 'off', 'Name', 'Problem 2.2.3');

set(gcf,'Color','white');

hist(x3,100);

title('Uniformly Distributed Random Numbers (using hist)');

xlabel('n'); ylabel('x3(n)'); grid on;

figure('NumberTitle', 'off', 'Name', 'Problem 2.2.3');

set(gcf,'Color','white');

[counts,binlocal] = hist(x3, 100);

counts = counts/num;

bar(binlocal, counts, 1); title('Uniformly Distributed Random Numbers (using bar)');

xlabel('n'); ylabel('x3(n)'); grid on;

%% ---------------------------------- END ------------------------------------------------
运行结果:


两个均匀分布的序列相加,结果呈现三角形分布了。
4、代码:
%% ------------------------------------------------------------------------

%%            Output Info about this m-file

fprintf('\n***********************************************************\n');

fprintf('        <DSP using MATLAB> Problem 2.2.4 \n\n');

time_stamp = datestr(now, 31);

[wkd1, wkd2] = weekday(today, 'long');

fprintf('      Now is %20s, and it is %7s  \n\n', time_stamp, wkd2);

%% ------------------------------------------------------------------------

num = 100000;  n_y = 0:num-1;

y1 = -0.5 + (0.5+0.5)*rand(num,1);

y2 = -0.5 + (0.5+0.5)*rand(num,1);

y3 = -0.5 + (0.5+0.5)*rand(num,1);

y4 = -0.5 + (0.5+0.5)*rand(num,1);

%x_axis = min(x2):0.02:max(x2);

[x41,n_y11] = sigadd (y1, n_y, y2, n_y);

[x42,n_y12] = sigadd (y3, n_y, y4, n_y);

[x4,n_x4] = sigadd (x41, n_y11, x42, n_y12);

%% -------------------------------- START --------------------------------------------

%  x1(n)'s hist and bar function

figure('NumberTitle', 'off', 'Name', 'Problem 2.2.4');

set(gcf,'Color','white');

hist(y1,100);

title('Uniformly Distributed Random Numbers (using hist)');

xlabel('n'); ylabel('y1(n)'); grid on;

figure('NumberTitle', 'off', 'Name', 'Problem 2.2.4');

set(gcf,'Color','white');

[counts,binlocal] = hist(y1, 100);

counts = counts/num;

bar(binlocal, counts, 1); title('Uniformly Distributed Random Numbers (using bar)');

xlabel('n'); ylabel('y1(n)'); grid on;

%% ---------------------------------- END ------------------------------------------------

%% -------------------------------- START --------------------------------------------

%   x3(n) = x1(n) + x1(n-1)   hist and bar function

figure('NumberTitle', 'off', 'Name', 'Problem 2.2.4');

set(gcf,'Color','white');

hist(x4,100);

title('Uniformly Distributed Random Numbers (using hist)');

xlabel('n'); ylabel('x4(n)'); grid on;

figure('NumberTitle', 'off', 'Name', 'Problem 2.2.4');

set(gcf,'Color','white');

[counts,binlocal] = hist(x4, 100);

counts = counts/num;

bar(binlocal, counts, 1); title('Uniformly Distributed Random Numbers (using bar)');

xlabel('n'); ylabel('x4(n)'); grid on;

%% ---------------------------------- END ------------------------------------------------
运行结果:


4个均匀分布的随机序列相加,呈现正态分布的特征了。
《DSP using MATLAB》Problem 2.2的更多相关文章
- 《DSP using MATLAB》Problem 7.27
代码: %% ++++++++++++++++++++++++++++++++++++++++++++++++++++++++++++++++++++++++++++++++ %% Output In ...
- 《DSP using MATLAB》Problem 7.26
注意:高通的线性相位FIR滤波器,不能是第2类,所以其长度必须为奇数.这里取M=31,过渡带里采样值抄书上的. 代码: %% +++++++++++++++++++++++++++++++++++++ ...
- 《DSP using MATLAB》Problem 7.25
代码: %% ++++++++++++++++++++++++++++++++++++++++++++++++++++++++++++++++++++++++++++++++ %% Output In ...
- 《DSP using MATLAB》Problem 7.24
又到清明时节,…… 注意:带阻滤波器不能用第2类线性相位滤波器实现,我们采用第1类,长度为基数,选M=61 代码: %% +++++++++++++++++++++++++++++++++++++++ ...
- 《DSP using MATLAB》Problem 7.23
%% ++++++++++++++++++++++++++++++++++++++++++++++++++++++++++++++++++++++++++++++++ %% Output Info a ...
- 《DSP using MATLAB》Problem 7.16
使用一种固定窗函数法设计带通滤波器. 代码: %% ++++++++++++++++++++++++++++++++++++++++++++++++++++++++++++++++++++++++++ ...
- 《DSP using MATLAB》Problem 7.15
用Kaiser窗方法设计一个台阶状滤波器. 代码: %% +++++++++++++++++++++++++++++++++++++++++++++++++++++++++++++++++++++++ ...
- 《DSP using MATLAB》Problem 7.14
代码: %% ++++++++++++++++++++++++++++++++++++++++++++++++++++++++++++++++++++++++++++++++ %% Output In ...
- 《DSP using MATLAB》Problem 7.13
代码: %% ++++++++++++++++++++++++++++++++++++++++++++++++++++++++++++++++++++++++++++++++ %% Output In ...
- 《DSP using MATLAB》Problem 7.12
阻带衰减50dB,我们选Hamming窗 代码: %% ++++++++++++++++++++++++++++++++++++++++++++++++++++++++++++++++++++++++ ...
随机推荐
- 1 :2 Strust2—Demo
=============================================================== Demo基础包:
- VS2010/MFC编程入门之二十六(常用控件:滚动条控件Scroll Bar)
回顾上一节,鸡啄米讲的是组合框控件Combo Box的使用.本节详解滚动条控件Scroll Bar的相关内容. 滚动条控件简介 滚动条大家也很熟悉了,Windows窗口中很多都有滚动条.前面讲的列表框 ...
- 2017 Benelux Algorithm Programming Contest (BAPC 17) Solution
A - Amsterdam Distance 题意:极坐标系,给出两个点,求最短距离 思路:只有两种方式,取min 第一种,先走到0点,再走到终点 第二种,走到同一半径,再走过去 #include ...
- zw版【转发·台湾nvp系列Delphi例程】HALCON DispArc
zw版[转发·台湾nvp系列Delphi例程]HALCON DispArc zw版[转发·台湾nvp系列Delphi例程]HALCON DispArc----------RAD Studio XE D ...
- AI学习资料
OpenAI Gym介绍 http://m.blog.csdn.net/u010510350/article/details/71450232
- System.DateTimeKind 的用法
最近在使用SQLite的数据库,发现SQLiteConnection类,有一个属性DateTimeKind 去msdn上找了下资料,http://msdn.microsoft.com/en-us/li ...
- http://www.artrobot.com/北京钢铁侠
http://www.artrobot.com/ 钢铁侠ROS智能机器人 钢铁侠ROS智能机器人 型号 ARTrobot-ROS 产品图片: 产品概述: ARTrobot-ROS全开放机器人套件服 ...
- SSD-Tensorflow 从工程角度进行配置
目录 SSD-Tensorflow 工程角度配置 Download from the github 数据集转化tfrecords格式 训练模型(pre-train) 训练方案一 训练方案二 训练方案3 ...
- POJ 3320 Jessica‘s Reading Problem(哈希、尺取法)
http://poj.org/problem?id=3320 题意:给出一串数字,要求包含所有数字的最短长度. 思路: 哈希一直不是很会用,这道题也是参考了别人的代码,想了很久. #include&l ...
- 使用javascript模拟常见数据结构(四)
七.树 树是一种非线性的分层的数据结构,在现实生活中比较常见的例子比如家谱和公司的组织架构图,如下所示: 一个树结构存在着一系列的父子结构,并且有着一个根节点,这种结构本质上表明了一对多的关系. 那, ...